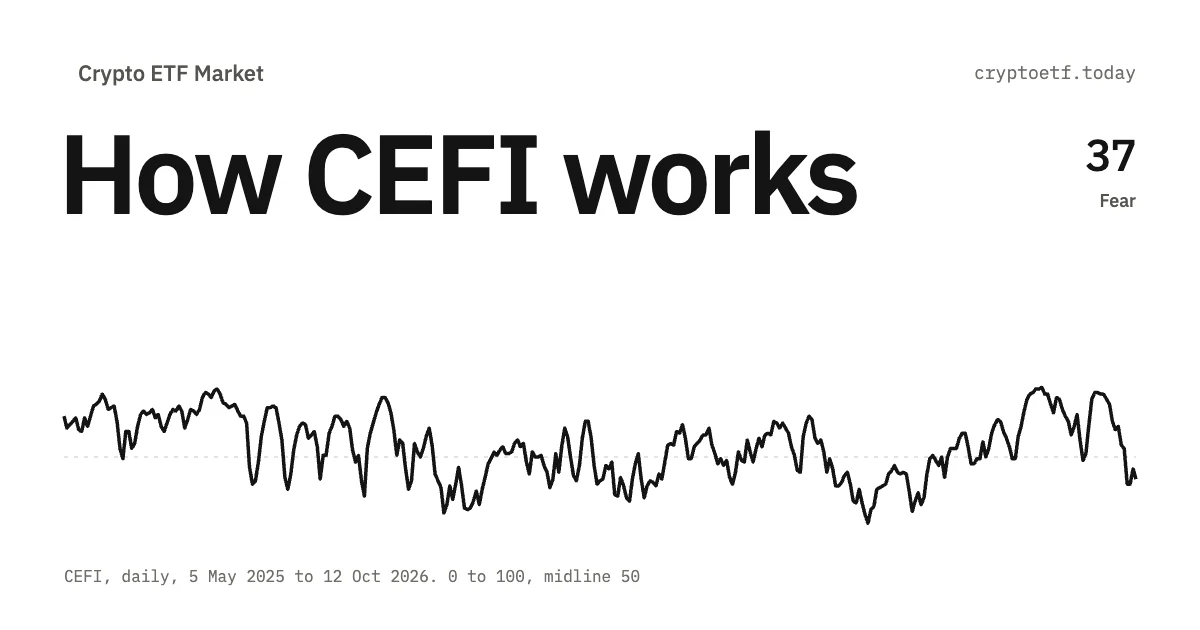
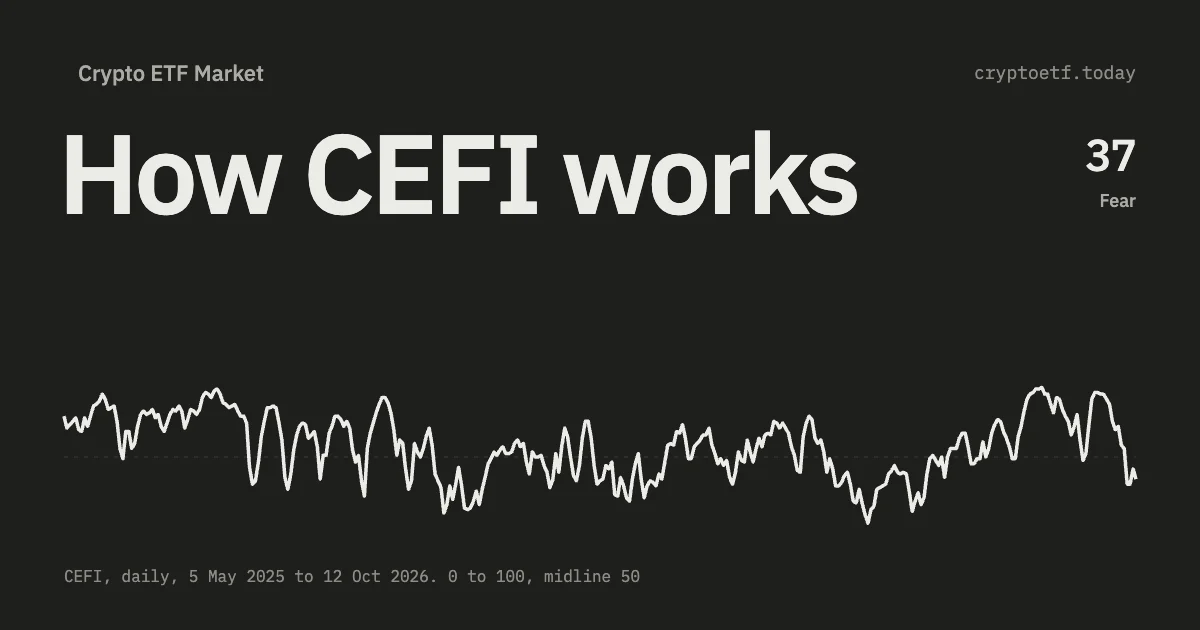
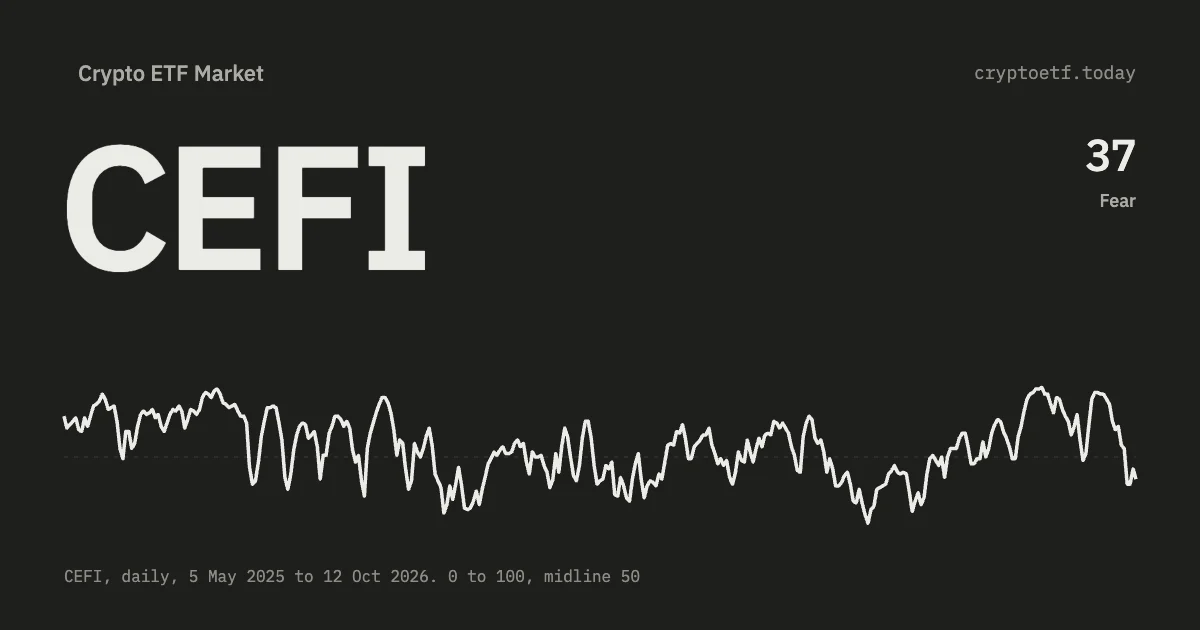
Same 0–100 scale, different inputs. Fear & Greed blends volatility (25%), momentum (25%) and social (15%) around Bitcoin; CEFI reads one thing, spot ETF net flow, across 16 assets.
TL;DR. Both indexes print a number from 0 to 100 with the same five labels, and that is where the resemblance ends. The Crypto Fear & Greed Index from alternative.me is a sentiment blend around Bitcoin: volatility 25%, momentum and volume 25%, social media 15%, surveys 15% (paused), dominance 10%, Google Trends 10%. CEFI, the Crypto ETF Flow Index, has one input: the daily net dollar flow into US spot crypto ETFs on 16 assets, scored as today’s flow, the 20-day trend and breadth, with 50 meaning zero net flow. Over 705 trading days from January 2024 the two were on the same side of neutral 57.7% of the time and on opposite sides 8.8% of the time. On 4 August 2025 Bitcoin rose 1.6% while the ETFs lost a net $788.6m: CEFI fell to 34, Fear, and Fear & Greed printed 60, Greed. Neither was wrong. They answer different questions.
Contents · 11 sections
Method change, October 2026. CEFI was recalculated with a new method on 3 October 2026, and every CEFI value in this article comes from the current method. The previous version scaled each asset’s flow by its market capitalisation, compared flow with a 90-day average and counted weekends as zero-flow days; earlier versions of this article quoted readings from it, including per-asset scores the site no longer shows.
Two indexes, one scale, different questions
The Fear & Greed Index asks how the crowd feels about Bitcoin today. Its inputs are things a crowd produces (price swings, posts, searches), and it has printed a daily value since 1 February 2018: the history pulled from its public API on 3 October 2026 held 3,163 readings, from a low of 5 to a high of 95.
CEFI asks a narrower question: is regulated money entering or leaving the US spot crypto ETFs, and how strongly compared with the past year? Its only raw input is the flow series on the Bitcoin ETF flow page and its fifteen siblings, produced by authorised participants creating and redeeming shares, not by the crowd. The arithmetic is in how the CEFI index is calculated; this article is about putting the two numbers next to each other.
Because they share a scale and the same labels, people read them as competing measures of one thing. They aren't. One measures mood, the other measures capital, and the interesting days are the ones where the two disagree.
Side-by-side
| Crypto Fear & Greed (alternative.me) | CEFI (cryptoetf.today) | |
|---|---|---|
| What it measures | Market sentiment towards Bitcoin | Net money flowing into or out of US spot crypto ETFs |
| Inputs | Volatility 25%, momentum/volume 25%, social media 15%, surveys 15% (paused), BTC dominance 10%, Google Trends 10% | Daily net creation/redemption value per fund, in USD. Nothing else |
| Assets | Bitcoin only (the site says altcoin versions are planned) | One composite over 16 assets, added up in dollars |
| Construction | Weighted blend of the six inputs | Flow (40%), 20-day trend (30%), breadth (30%), each scored 50 + 50 × tanh(0.4 × value ÷ scale) |
| What 50 means | Balanced sentiment | Zero net flow |
| Labels | Extreme Fear 0–25, Fear 26–46, Neutral 47–54, Greed 55–75, Extreme Greed 76–100 (as the API labels its own history) | Extreme Fear 0–19, Fear 20–39, Neutral 40–59, Greed 60–79, Extreme Greed 80–100 |
| Update cadence | Once a day at 00:00 UTC, every calendar day | Once per trading day, after the day’s flows are published; no weekend rows |
| Memory | Volatility and volume against 30- and 90-day averages | Smoothing with lambda 0.3 (a day’s influence halves every ~2 trading days), a 20-day trend, and a scale built from the past 250 trading days |
| History | Since 1 February 2018 | Since 11 January 2024, the first spot Bitcoin ETF trading day |
| Price sensitivity | Direct: volatility and momentum are half the weight | None |
Two rows deserve a second look. The thresholds don't line up: 56 is already Greed on Fear & Greed and still Neutral on CEFI. And when Fear & Greed says the market is greedy, it means Bitcoin, while CEFI adds up the money in all 16 complexes; Bitcoin and Ethereum dominate it, but a heavy redemption day in the Ethereum funds can pull it down while Bitcoin is calm.
What goes into Fear & Greed
alternative.me publishes the recipe on the index page. Volatility (25%) compares Bitcoin's current volatility and maximum drawdown with its 30- and 90-day averages; a spike reads as fear. Momentum and volume (25%) do the same for volume and price momentum, with high readings taken as greed. Social media (15%) counts Bitcoin hashtag posts and interaction rates on Twitter (X), with Reddit still labelled experimental. Surveys (15%) came from weekly strawpoll.com polls of two to three thousand votes and are currently paused, so the live index is effectively built from the other 85%. Dominance (10%) treats a rising Bitcoin market share as fear and a falling one as greed. Trends (10%) reads Google search volume for Bitcoin queries.
CoinMarketCap runs a variant with five factors: price momentum of the top 10 non-stablecoin coins, Volmex implied volatility (BVIV and EVIV) for Bitcoin and Ether, the BTC and ETH options put/call ratio, the stablecoin supply ratio, and its own social and engagement data. It is broader and leans on derivatives, but the page doesn't publish component weights, so it can't be reproduced by hand the way the original can.
The common thread: every input is either the price or a reaction to it. Volatility is price. Momentum is price. Posts, searches and put/call ratios follow price within hours. Fear & Greed is best read as a well-built summary of how the last few days of price action felt.
What goes into CEFI
CEFI starts from a number the market doesn't produce directly: the net value of ETF shares created minus redeemed on a trading day (crypto ETF flows explained covers where it comes from). The calculator adds those flows up in dollars across all funds on 16 assets and scores three parts: the day’s flow after smoothing, the sum of the last 20 trading days, and breadth, the share of funds taking money in. Each part is compared with the median of its own past values of the same sign over the last 250 trading days, so a typical inflow day scores about 69 and a typical outflow day about 31. The index is the weighted average of the three.
Notice what isn't there. No price return, no volume, no volatility, no open interest, no social feed. A 10% price move on a day with zero creations and redemptions doesn't touch the score. The index deliberately ignores everything Fear & Greed is built from.
One timing detail matters when comparing the two. alternative.me stamps each value at 00:00 UTC, so the reading dated 20 August reflects trading on 19 August. In the tables below each CEFI trading day is paired with the Fear & Greed reading stamped the following morning.
How often they agree
Pairing every CEFI trading day from 11 January 2024 to 2 October 2026 with the next Fear & Greed reading gives 705 pairs. The two were on the same side (both Fear or worse, both Neutral, or both Greed or better) on 407 of them, 57.7%, and on opposite sides on 62, 8.8%. The correlation between the two numbers is 0.70. Opposite sides almost always meant CEFI in Greed while Fear & Greed was in Fear: 49 days, against 13 the other way round. Since 2024 ETF money has kept arriving through stretches when the mood around Bitcoin was gloomy.
Where they diverge, and why
Take the weeks from 7 August to 21 September 2026 (Bitcoin daily closes in UTC, flows from the tracker, Fear & Greed from its API).
| Date (2026) | BTC price move | Net ETF flow, all 16 assets | Fear & Greed (next morning) | CEFI |
|---|---|---|---|---|
| 7 Aug (Fri) | +0.9% | +$151.3m | 30 Fear | 71 Greed |
| 11 Aug (Tue) | −0.6% | +$6.7m | 27 Fear | 60 Greed |
| 13 Aug (Thu) | 0.0% | −$123.1m | 29 Fear | 48 Neutral |
| 17 Aug (Mon) | +2.4% | +$331.0m | 41 Fear | 62 Greed |
| 18 Aug (Tue) | +0.3% | +$268.9m | 46 Fear | 68 Greed |
| 19 Aug (Wed) | +7.1% | +$711.6m | 62 Greed | 77 Greed |
| 20 Aug (Thu) | +5.3% | +$863.7m | 72 Greed | 85 Extreme Greed |
| 27 Aug (Thu) | +1.6% | +$576.7m | 73 Greed | 91 Extreme Greed |
| 15 Sep (Tue) | −3.3% | −$585.0m | 51 Neutral | 60 Greed |
| 16 Sep (Wed) | +0.7% | −$513.0m | 50 Neutral | 48 Neutral |
| 21 Sep (Mon) | +7.1% | +$1,302.6m | 78 Extreme Greed | 84 Extreme Greed |
Pattern one: the labels disagree for days at a time. From 4 to 11 August Fear & Greed sat at 25–30, Fear and Extreme Fear, while CEFI held 60–71, Greed. Bitcoin drifted around $63,000–65,000, the sentiment inputs read that as gloom, and the ETFs kept taking in modest amounts most days. Two honest readings of two different things.
Pattern two: flows can move before mood. On 17 and 18 August the ETFs took in $331m and $269m while Fear & Greed was still at 41 and 46. Bitcoin jumped 7.1% on 19 August, and the reading stamped the next morning crossed into Greed. One episode, not a rule, but it shows the mechanical difference: a creation is a decision taken before the price reacts, a sentiment input is a reaction after it.
Pattern three: one bad day versus a good month. On 15 September the market lost a net $585m and Bitcoin fell 3.3%. CEFI’s flow part dropped to 37, but the 20-day trend part stayed at 85, so the index printed 60, still Greed, while Fear & Greed fell to Neutral. CEFI is built to separate one redemption day from a change of direction; the next day’s further −$513m took it to 48.
A worked day: 4 August 2025
Bitcoin closed at about $115,100 on 4 August 2025, up 1.6% on the day. Momentum positive, volatility unremarkable. Fear & Greed read 64 that morning and 60 the next: Greed.
The ETFs had a heavy redemption day: a net −$788.6m across the 16 assets, −$465.1m from the Ethereum funds and −$323.5m from the Bitcoin funds, after −$964.6m the previous Friday. CEFI’s flow part was 3, breadth 29 (most funds that moved money lost it), and only the 20-day trend, at 79, still remembered the strong July. The index fell from 44 to 34: Fear.
So on one day the sentiment gauge said Greed and the flow gauge said Fear. A reader of only Fear & Greed saw a market recovering; a reader of only CEFI saw institutional money leaving. Both were true. The following day Bitcoin slipped 0.8% on a further −$122.9m and Fear & Greed dropped to Neutral at 54; a day later a net +$126.7m lifted CEFI to 47. The point isn't that either index called the move. It is that the divergence was visible, dated and explainable, and what a Bitcoin ETF outflow day means is a question you can only ask if you have a flow-based reading at all.
How to use them together
Treat the pair as a two-by-two, not as a contest.
| Fear & Greed high (Greed) | Fear & Greed low (Fear) | |
|---|---|---|
| CEFI high (Greed) | Mood and capital agree. 20–27 August 2026: Fear & Greed 65–74, CEFI 85–91, net inflows of $462m–$864m a day. The most crowded state | Capital arriving into a gloomy tape. 4–18 August 2026. The most common divergence, 49 days since 2024 |
| CEFI low (Fear) | Price up, money out. 4 August 2025; 13–14 January 2025, when CEFI was at 25 and 21 and Fear & Greed at 63 and 70. The rally lacks the ETF bid; ask who is buying instead | Mood and capital agree on the downside. 26–27 February 2025: CEFI 3 and 2 after −$852.1m and −$347.1m days, Fear & Greed 10 and 16 |
Three rules follow. Compare labels loosely and numbers not at all: a 65 on one scale isn't a 65 on the other. When they disagree, ask which input is doing the work: Fear & Greed falling on a flat price is a non-price input; CEFI falling on a flat price is always redemptions. And look at CEFI’s three components: a low flow part under a high trend part is one bad day inside a good month, which is a different situation from all three falling together.
The current index with its components is on the crypto ETF sentiment index page, with the flow rows behind it one click away on each asset page. Why flows and mood part ways (rates, the dollar, equities) is covered in macro impact on Bitcoin ETF flows.
The honest limits of both
Fear & Greed is a black box in places. The weights are published, the sub-scores aren't, and the survey component is paused without the weights being restated. It is Bitcoin-only. And because half the weight is price-derived, it tends to confirm the move already visible on the chart.
CEFI is descriptive, not predictive. Nothing in the pipeline is fitted to returns, and no back-test is claimed. It measures money in dollars, so Bitcoin and Ethereum dominate it and a dramatic day in a small complex barely registers. Its scale follows the last year, so the same dollar day scores differently in a busy year and a quiet one. It sees only the ETF wrapper: a day when exchange spot volume doubles and creations are flat is invisible to it, and as net flow versus volume explains, ETF trading volume (which Fear & Greed partly captures) is a different quantity from net flow.
Neither is a signal on its own. Fear & Greed tells you how the last few days felt; CEFI tells you whether the regulated wrapper is filling or draining, and how strongly. The days they disagree are the days worth reading the flow table by hand.
FAQ
Is CEFI the same as the Crypto Fear and Greed Index?
No. They share a 0–100 scale and five labels, but the alternative.me index blends volatility (25%), momentum and volume (25%), social media (15%), surveys (15%, paused), Bitcoin dominance (10%) and Google Trends (10%). CEFI uses one input, the daily net flow into US spot crypto ETFs on 16 assets, and no price or sentiment component.
Why can Fear and Greed be in Greed while CEFI is in Fear?
Because price can rise while ETF investors redeem. On 4 August 2025 Bitcoin gained 1.6% and Fear and Greed read 60, Greed, while spot crypto ETFs lost a net $788.6m and CEFI fell from 44 to 34. Since January 2024 that combination appeared on 13 trading days; the reverse, CEFI in Greed with Fear and Greed in Fear, on 49.
How often do the two indexes agree?
Over 705 trading days from January 2024 to October 2026 they were on the same side of neutral 57.7% of the time and on opposite sides 8.8% of the time, with a correlation of 0.70. Each CEFI day is paired with the Fear and Greed reading stamped the following morning, because alternative.me publishes at 00:00 UTC.
Which index updates faster?
Fear and Greed publishes one value every calendar day at 00:00 UTC. CEFI moves once per trading day, when the day’s ETF flows are published; there are no weekend rows.
Are the Fear, Neutral and Greed thresholds the same on both indexes?
No. The Fear and Greed API labels 0–25 Extreme Fear, 26–46 Fear, 47–54 Neutral, 55–75 Greed and 76–100 Extreme Greed. CEFI uses even bands: 0–19, 20–39, 40–59, 60–79, 80–100. A 56 is Greed on one and Neutral on the other.
Can CEFI predict Bitcoin price?
It is not designed to and makes no such claim. CEFI scores how strongly money is flowing into or out of US spot crypto ETFs; nothing in it is fitted or back-tested against returns. It is context for a price move, not a forecast of one.
Sources and further reading
- alternative.me, Crypto Fear & Greed Index, methodology and component weights — alternative.me.
- alternative.me, Fear & Greed public API (daily history since 1 February 2018; values quoted as of 3 October 2026) — api.alternative.me.
- CoinMarketCap, Crypto Fear & Greed Index, methodology — coinmarketcap.com.
- Internal: how the CEFI index is calculated, how to read Bitcoin ETF flows, live sentiment index.
For information only. Not investment advice.
 BTC
 ETH
 SOL
 XRP
 HYPE
 LINK
 HBAR
 AVAX
 DOGE
 LTC
 SUI
 DOT
 BNB
 NEAR
 TRX
 ZEC