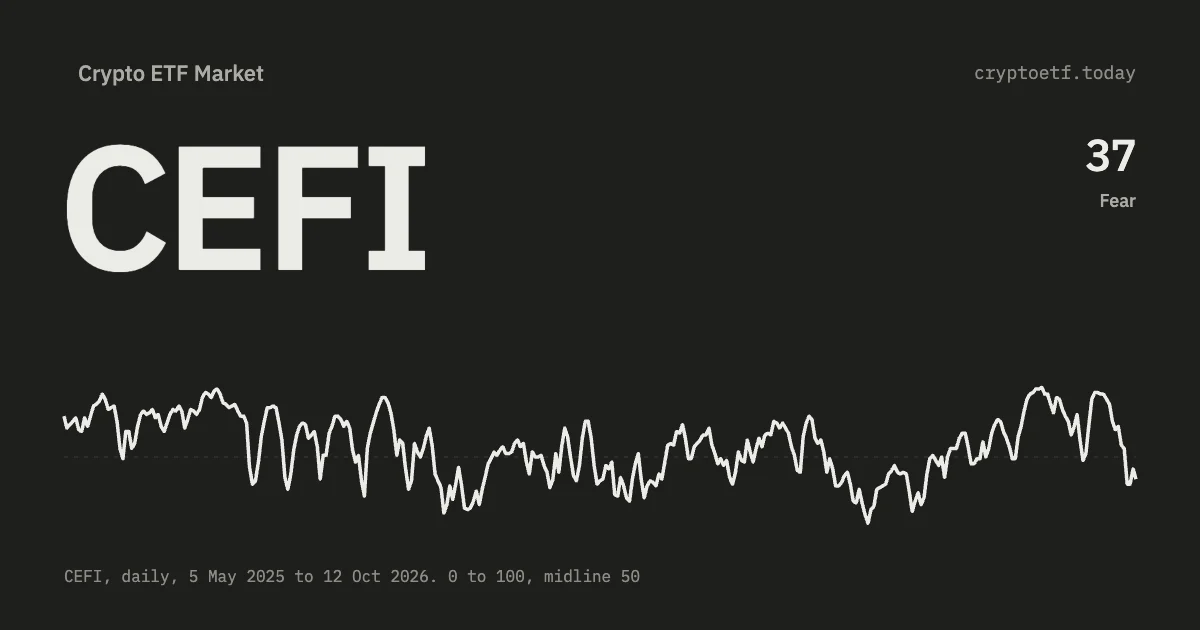
CEFI adds up the net dollar flow of every US spot crypto ETF on 16 assets and scores three parts against the past year: today’s flow, the 20-day trend and breadth. Zero flow is 50.
TL;DR. The Crypto ETF Flow Index (CEFI) starts from the net dollar flow of every US spot crypto ETF on the 16 assets we track and scores three parts each trading day: today’s flow, smoothed with an exponential moving average (lambda 0.3), weighted 40%; the net flow of the last 20 trading days, 30%; and breadth, the share of funds with inflows, 30%. Each part is compared with the median of its own past values of the same sign over the last 250 trading days and mapped with 50 + 50 × tanh(0.4 × value ÷ scale). Zero net flow scores 50, a typical inflow day about 69, a typical outflow day about 31. Nothing in it looks at price, volume, volatility, social media or open interest.
Contents · 13 sections
- What goes in
- Step 1: add up the dollars
- Step 2: count the funds that took money in
- Step 3: smoothing and the trend window
- Step 4: compare each part with its own past
- Step 5: from ratio to 0–100
- The five zones
- A worked example: 22 September 2026
- The three parts read differently
- What CEFI can't see
- Where to check the numbers yourself
- FAQ
- Sources and further reading
Method change, October 2026. From 3 October 2026 CEFI is calculated with the method described here, and its whole history was recalculated. The previous version weighted funds by their cumulative flow, divided each asset’s flow by its market capitalisation, added the assets with equal weight, z-scored the result against a 90-row window and counted weekends as zero-flow days. In practice small new funds could outweigh bitcoin, and a quiet day after a strong week read as fear. Earlier versions of this article described that method.
What goes in
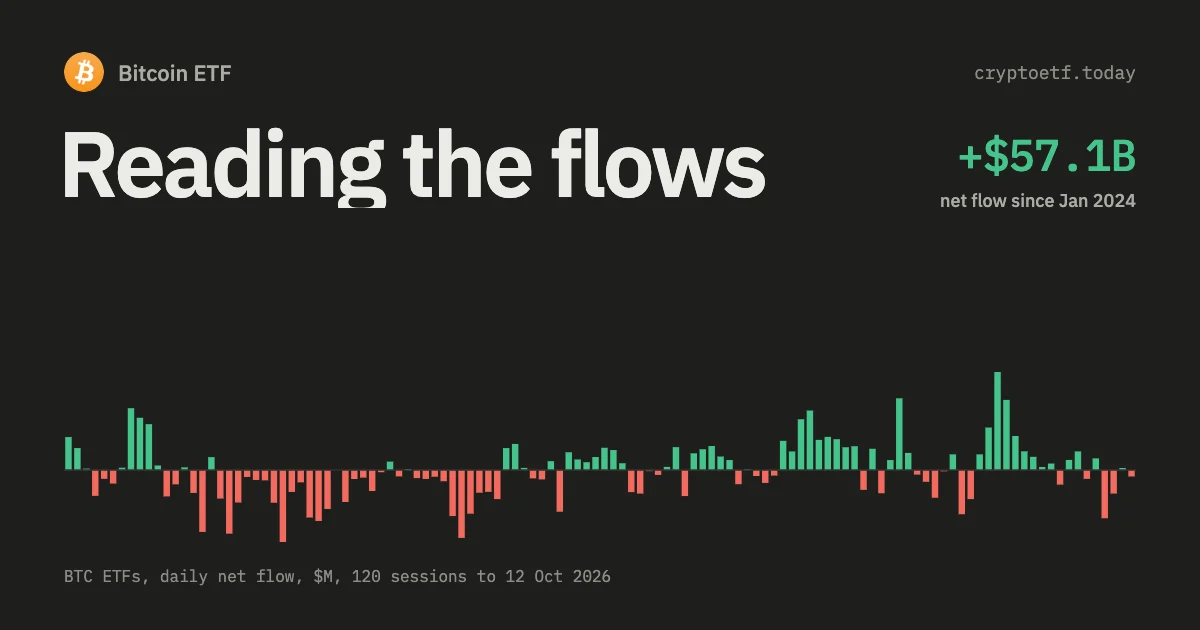
The only raw input is the flow series you already see on the asset pages: for each published trading day, the net creation or redemption value of each spot ETF, in millions of US dollars. If that number is unfamiliar, how to read Bitcoin ETF flows explains where it comes from and why it is not volume.
For the five original assets (BTC, ETH, SOL, XRP, HYPE) the calculator reads every fund column in the flow tables: twelve for Bitcoin, eleven for Ethereum, nine for Solana, five for XRP and three for Hyperliquid. For the eleven newer assets (DOGE, LINK, AVAX, HBAR, LTC, BNB, DOT, SUI, NEAR, TRX, ZEC), whose flows the site computes from issuer disclosures because no aggregator covers them, it reads the daily total per asset for the dollar sum and the per-fund flows for breadth.
The calendar is trading days only. A day appears in the series when at least one fund has a flow row for it; weekends and market holidays are not rows at all, and a trailing "today" row with no flows yet is dropped. The introductory piece, CEFI index explained, covers what the score is for. This article is about the arithmetic, and every constant below is quoted from the calculator in the backend.
Step 1: add up the dollars
For each trading day the calculator adds the net flow of every fund on every asset into one number, the market’s net flow in US dollars. Nothing is weighted or rescaled at this stage. A $500m day in the Bitcoin funds counts as $500m, and a $5m day in a Dogecoin fund counts as $5m.
That choice decides what the index is about. Each asset contributes in proportion to the money moving through its funds, so the composite is dominated by Bitcoin and Ethereum because that is where the money is. A launch day of a small new fund, which can be large relative to its own coin, barely registers against the whole market.
Step 2: count the funds that took money in
The same pass counts the funds that moved money that day. A fund counts as active if its flow is at least $50,000 in either direction; smaller numbers are rounding noise. Breadth for the day is the share of active funds with a positive flow, minus 0.5, so a day where every active fund took money in is +0.5, a day where every one lost money is −0.5, and an even split is 0. On a day with no active funds breadth is 0. On recent busy days around 30 funds were active; on quiet days fewer than ten.
Step 3: smoothing and the trend window
Daily flows are lumpy, so the flow and breadth series are run through an exponentially weighted moving average:
smoothed(t) = 0.3 × value(t) + 0.7 × smoothed(t − 1)
The first row takes its own value as the starting point. Today gets 30% of the say and the running value 70%, so the influence of one day halves roughly every two trading days and is under 3% after ten. The constant 0.3 sits at the top of the 0.2–0.3 range the NIST engineering handbook describes as typical for EWMA monitoring.
The trend part uses no smoothing. It is the plain sum of the market’s net flow over the latest 20 trading days, about a calendar month, including today.
Step 4: compare each part with its own past
A dollar figure on its own says little, so each of the three series (smoothed flow, 20-day sum, smoothed breadth) is compared with what is typical for it. The scale is the median of the series’ past values of the same sign over the previous 250 trading days, roughly a year. A positive value is measured against the median past positive value, a negative value against the median past negative value, and today’s value is never part of its own scale.
| Rule | Value in code | Why |
|---|---|---|
| Scale window | 250 trading days | About a year of history, so the scale follows the market as it grows. |
| Scale statistic | Median | A single record day barely moves a median, so one outlier cannot stretch the scale. |
| Separate scales | Inflows and outflows | From January 2024 to October 2026 there were 412 inflow days against 277 outflow days, and the median inflow day ($266.3m) was larger than the median outflow day ($186.1m). One shared scale would leave the index in Greed most of the time. |
| Minimum history | 10 values of the same sign | With fewer, the median of both signs is used instead. |
| Warm-up | 20 values in total | Below that a part is not scored at all, and the index uses the parts that are. |
The ratio of today’s value to its scale goes into the map below. A ratio of 1 means "a typical day of that sign". Because the scale is only ever built from past rows, adding new data never rewrites earlier scores.
Step 5: from ratio to 0–100
Each part is scored as
score = 50 + 50 × tanh(0.4 × value ÷ scale)
The hyperbolic tangent keeps the result strictly between 0 and 100, and the 0.4 sets how fast it saturates.
| Value ÷ scale | Score of the part | Plain reading |
|---|---|---|
| 0 | 50 | Zero net flow, or an even split of funds |
| 0.5 | 60 | Half a typical inflow day |
| 1 | 69 | A typical inflow day |
| 1.73 | 80 | The start of Extreme Greed for this part |
| 2 | 83 | Twice a typical inflow day |
| 3 | 92 | Three times a typical inflow day |
| 5 | 98 | Five times a typical inflow day |
Negative values mirror the table: a typical outflow day scores 31, and twice a typical outflow day 17. Moving from 50 to 60 takes half a typical day; moving from 92 to 98 takes two more. 100 and 0 are unreachable.
The index is the weighted average of the three scores, 0.4 × flow + 0.3 × trend + 0.3 × breadth, rounded to a whole number. If a part is not yet scored (only in the first weeks of the history), the weights of the remaining parts are rescaled to add up to one; if none is scored, the index is 50. In the series that starts on 11 January 2024 all three parts are scored from 30 January 2024.
The five zones
The zone labels live in the website, not the calculator, and they are plain thresholds on the rounded index.
| Score | Zone | Trading days, 11 Jan 2024 – 2 Oct 2026 |
|---|---|---|
| 80–100 | Extreme Greed | 89 (12.6%) |
| 60–79 | Greed | 262 (37.1%) |
| 40–59 | Neutral | 219 (31.0%) |
| 20–39 | Fear | 117 (16.6%) |
| 0–19 | Extreme Fear | 19 (2.7%) |
Across those 706 trading days the index ranged from 2 to 91 and averaged 57.3. The tilt towards Greed is a fact of the period, not a setting: net inflows have outnumbered outflows since the first spot ETFs listed. Because the index is an average of three parts, a single part can sit in Extreme Greed while the total is only in Greed.
A worked example: 22 September 2026
Take a real day. On Tuesday 22 September 2026 the US spot crypto ETFs took in a net $964.5m across all 16 assets, $714.7m of it into the Bitcoin funds, and all 23 funds that moved money took it in.
| Part | Calculation | Result |
|---|---|---|
| Flow | Smoothed: 0.3 × $964.5m + 0.7 × $480.4m = $625.6m. Scale (median past positive smoothed flow) $152.8m. 50 + 50 × tanh(0.4 × 4.09) | 96.4 |
| Trend | 20-day sum $4,436.1m. Scale (median past positive 20-day sum) $2,520.3m. 50 + 50 × tanh(0.4 × 1.76) | 80.3 |
| Breadth | 23 of 23 funds positive: +0.50. Smoothed: 0.3 × 0.50 + 0.7 × 0.23 = 0.31. Scale about 0.14 | 84.8 |
| Index | 0.4 × 96.4 + 0.3 × 80.3 + 0.3 × 84.8 | 88.1 → 88, Extreme Greed |
The flow part was near the top of its range because the smoothed flow was about four times a typical inflow day. The trend part was lower: the month had been strong, but not unusually so for a 20-day window. The day before, with $1,302.6m of inflows, the index printed 84.
The three parts read differently
Each component answers its own question, and they often disagree. Flow reacts within a day or two. Trend changes slowly and keeps the index from flipping on one redemption day: on 15 September 2026 the market lost a net $585m, the flow part fell to 37, but the trend part stayed at 85 and the index printed 60. Breadth tells you whether a move is broad or driven by a few large funds. Across the history the gap between the highest and lowest part was 30 points or more on 230 of 693 scored days. The components are published with every reading, so you can see which part moved the index.
What CEFI can't see
- No price, volume or volatility. The only input is flow. A 15% price drop on zero creations or redemptions leaves the score untouched.
- No sentiment data. Unlike the Crypto Fear & Greed Index from alternative.me, which weights volatility at 25%, momentum and volume at 25%, social media at 15% and so on, CEFI has no survey, social feed or search-trend component.
- One value per trading day. Flows are published once per trading day, after the close. The backend recomputes the index on request with a short cache, but a new value appears only when a new day’s flows are in. The most recent day can still change slightly when the evening calculation replaces the morning figures.
- Size matters, by design. Bitcoin and Ethereum carry most of the weight because they carry most of the money. A dramatic day in a small complex barely shows in the composite; open that asset’s flow page to see it.
- Relative to a year. The scale follows the last 250 trading days. The same $300m day scores higher in a quiet year than in a busy one.
- Not a forecast. Nothing in the pipeline is fitted to returns. It is a summary of a flow series, nothing more.
Where to check the numbers yourself
The site’s endpoint GET /api/cefi/composite returns the full history. Each day carries the value and the three components, and the metadata block lists baseValue 50, smoothingFactor 0.3, windowSize 250 and method "v2". The public REST and MCP API at /v1/index/cefi serves the composite with 30 days of history. The older per-asset endpoints (/api/cefi/btc and the others) are still online, but the site no longer shows them and they still use the pre-October method. The daily flow inputs are on each asset page, starting with Bitcoin ETF flows.
To reproduce a score by hand you need the daily fund flows and the constants above. The rest is arithmetic.
FAQ
What is the exact CEFI formula?
Each trading day: add up the net dollar flows of all spot ETFs on the 16 assets. Score three parts: the flow smoothed with an EWMA (0.3 × today + 0.7 × yesterday), the 20-day sum of flows, and breadth (share of funds with inflows minus 0.5, smoothed the same way). Each part is scored as 50 + 50 × tanh(0.4 × value ÷ scale), where the scale is the median of its past values of the same sign over 250 trading days. The index is 0.4 × flow + 0.3 × trend + 0.3 × breadth, rounded.
Why is zero flow equal to 50?
Because each part is scored against zero, not against a recent average. A day with no net flow and an even split of funds scores 50 on every part. A typical inflow day scores about 69 on the flow part and a typical outflow day about 31.
Why are inflows and outflows measured on separate scales?
Between January 2024 and October 2026 there were 412 net inflow days against 277 outflow days, and the median inflow day was $266.3m against $186.1m for the median outflow day. One shared scale would leave the index in Greed most of the time and make outflows look small. With separate medians, an ordinary outflow day reads as clearly negative.
How often does the CEFI index update?
Once per trading day. The inputs are end-of-day ETF flows; a new value appears when a new day’s flows are published. There are no weekend rows and no intraday readings.
Do DOGE, LINK and the other newer assets count?
Yes. All 16 assets enter the dollar sum and the breadth count from the first day of their flows. Because the sum is in dollars, a small complex counts in proportion to the money moving through its funds.
Is CEFI the same as the Crypto Fear and Greed Index?
No. Both use a 0–100 scale with the same five labels, but the alternative.me index blends volatility, momentum and volume, social media, dominance and search trends. CEFI uses one input, spot ETF net flow, and no sentiment or price component at all.
Sources and further reading
- NIST/SEMATECH e-Handbook of Statistical Methods, EWMA control charts (definition of the exponentially weighted moving average and the typical lambda range) — itl.nist.gov.
- SEC, statement on the approval of spot bitcoin exchange-traded products, 10 January 2024 — sec.gov.
- alternative.me, Crypto Fear & Greed Index methodology (component weights) — alternative.me.
- Internal: CEFI index explained, how to read Bitcoin ETF flows, live sentiment index.
For information only. Not investment advice.

 BTC
 ETH
 SOL
 XRP
 HYPE
 LINK
 HBAR
 AVAX
 DOGE
 LTC
 SUI
 DOT
 BNB
 NEAR
 TRX
 ZEC