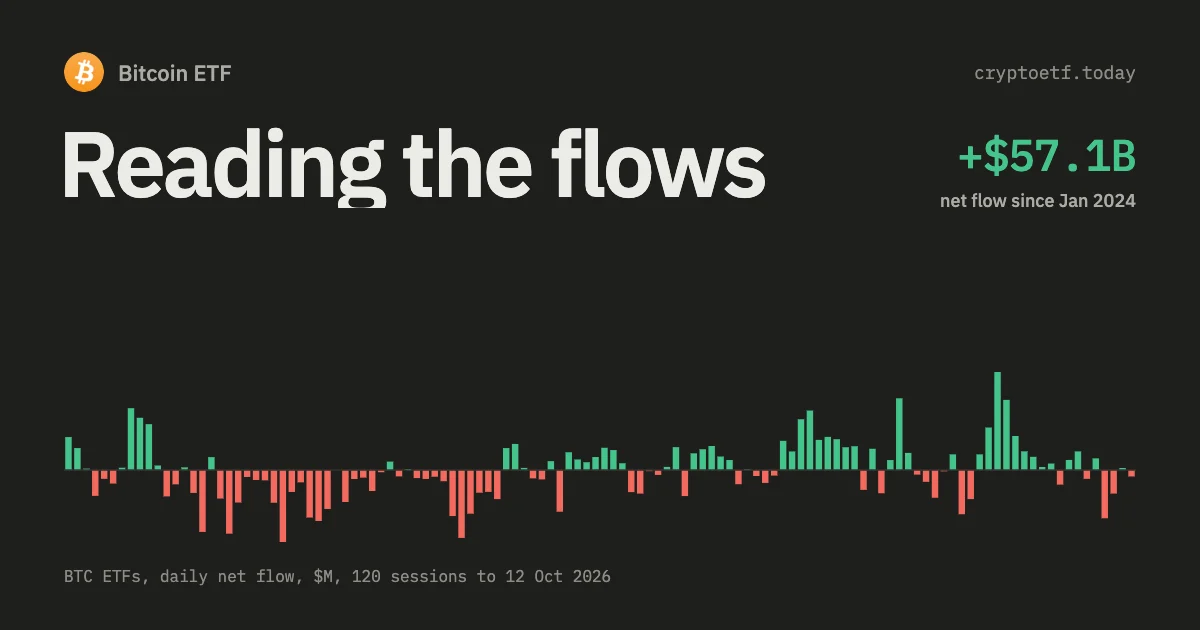
A red day on the flow chart can mean three completely different things, and only one of them is selling. Here is how to tell them apart, with dates, sizes and the measured correlation with price.
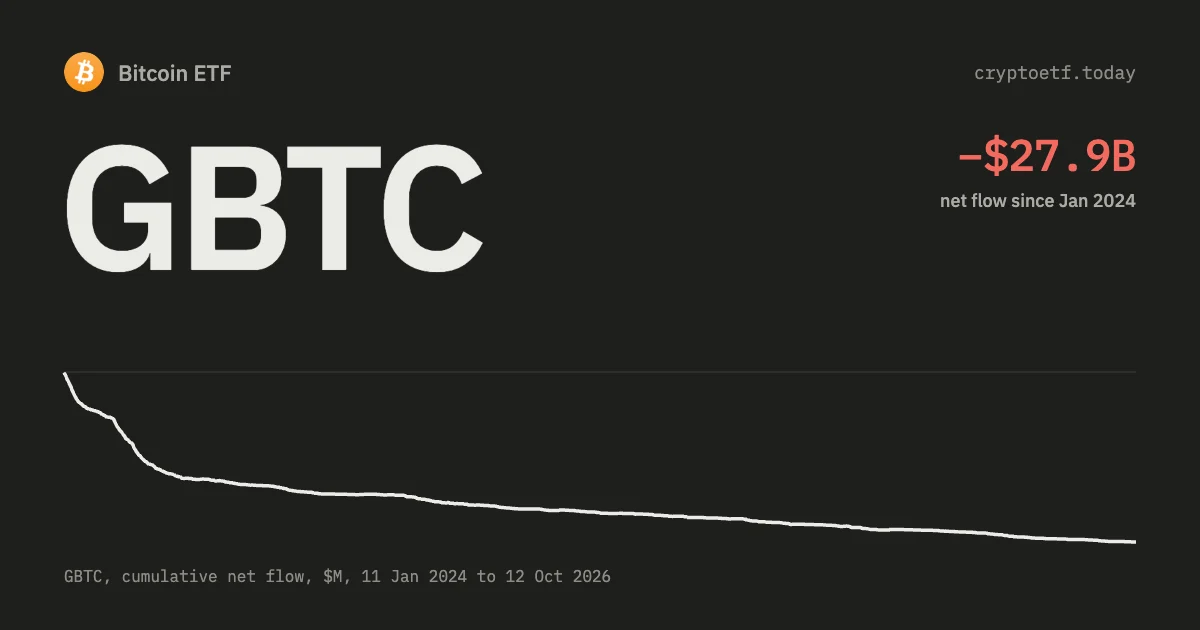
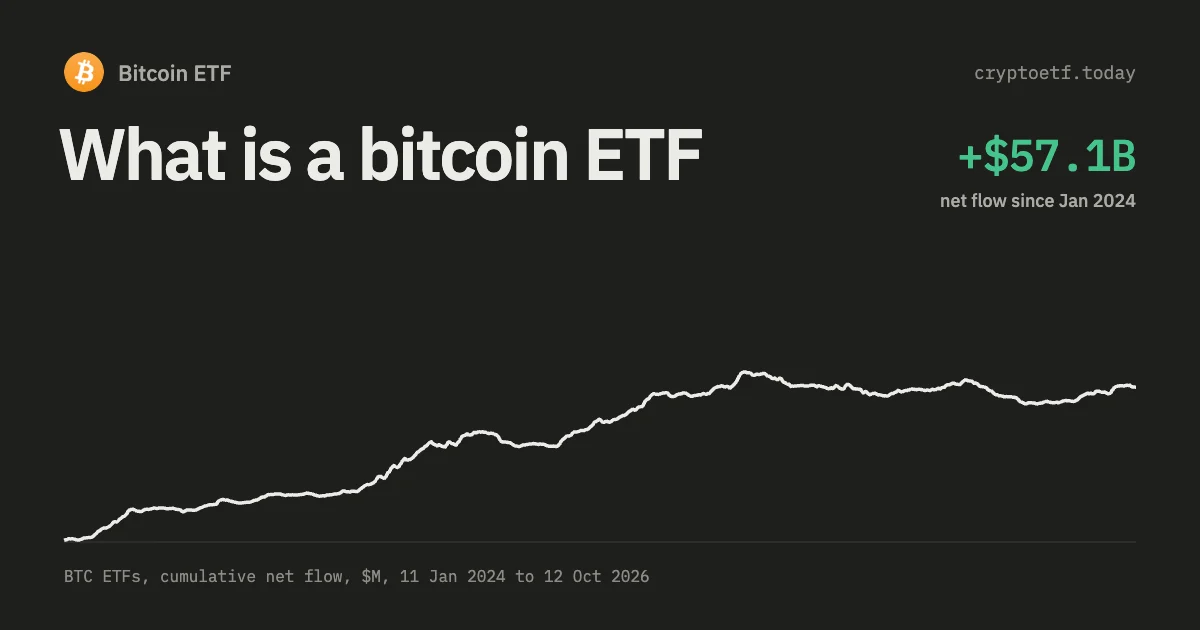
TL;DR. An ETF outflow is a fall in shares outstanding priced at that day's NAV. It is not a synonym for "someone sold bitcoin". Over 676 sessions from 11 January 2024 to 22 September 2026 the twelve US spot funds took in $56.94bn net, and 274 of those sessions were red. Grayscale's GBTC accounts for −$27.84bn of the total on its own, and on 36 red sessions GBTC was the only reason the category number had a minus sign: strip it out and those days sum to +$5.27bn. Since the SEC allowed in-kind orders on 29 July 2025, a redemption doesn't have to touch the open market at all, and BlackRock's 10-Q shows $5.49bn of IBIT's $13.88bn of first-half-2026 redemptions were settled by handing bitcoin straight to the authorised participant. The median red day is −$160m, about 0.29% of the 1,210,299 BTC the category held at the June 2026 quarter end. What moves with price is duration and breadth, not the size of any single print.
Contents · 11 sections
- What the minus sign on a flow chart actually records
- Three different events print the same red bar
- How many red days were only Grayscale?
- The ten biggest outflow sessions, and what caused each
- Outflows against price: what the correlation actually is
- A ruler for the headline number
- When an outflow actually matters
- A five-minute routine for a red day
- How much of this data can you trust?
- FAQ
- Sources and further reading
 Bitcoin ETFsNet flow Fri 16 Oct0
What the minus sign on a flow chart actually records
Start with the arithmetic, because most of the confusion lives there. A daily flow for a spot Bitcoin ETF is computed from the fund's own share count:
flow(T) = (shares(T) − shares(T−1)) × NAV(T)
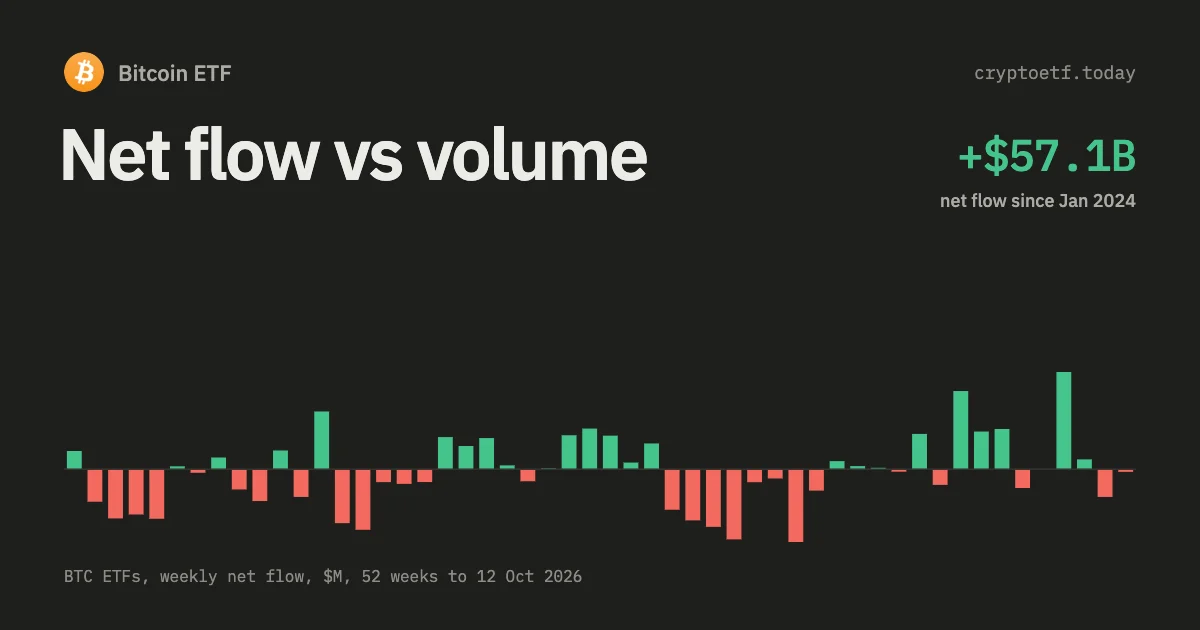
Shares outstanding only change when an authorised participant creates or redeems a basket with the trust. Everything else that happens to the fund during the day is invisible to this number. Millions of shares can change hands on Nasdaq or NYSE Arca between ordinary investors and the flow prints zero, because the trust was never a party to those trades. That gap between turnover and flow is the whole subject of net flow versus volume, and the mechanics of who is allowed to redeem are in how authorised participants work.
So a red bar tells you one thing with certainty: fewer shares exist tonight than existed last night. What it does not tell you is where the bitcoin went.
In-kind redemptions broke the old assumption
Until mid-2025 the assumption was safe enough. US spot bitcoin ETPs were approved on a cash-only basis, so a redemption forced the trust to sell coins and wire dollars. On 29 July 2025 the SEC approved orders permitting in-kind creations and redemptions for crypto ETPs, and BlackRock's 10-Q records the consequence: the 19b-4 orders landed that day, the amended S-1 went effective on 31 July 2025, and the trust has been authorised to deal in kind ever since.
The size of the change is visible in the same filing. For the six months to 30 June 2026 IBIT redeemed 192,970 bitcoin with a fair value of $13.88bn, and $5.49bn of that was paid in kind: coins moved from the trust's vault to the authorised participant's wallet and no sell order was ever entered. That's 39.6% of the fund's redemptions in the half. On the creation side the share is far higher, $9.36bn of $12.04bn, or 77.7%. When you read "IBIT saw a $300m outflow", the honest translation is that roughly two-fifths of it, on recent averages, was a wallet transfer.
The exception matters as much as the rule. Grayscale's GBTC states in its 30 June 2026 10-Q that authorised participants "may only submit orders to create or redeem Shares through transactions that are referred to as cash orders, as the agreements with Authorized Participants do not currently provide for in-kind creations and redemptions." Its sister fund, the Grayscale Bitcoin Mini Trust, says the opposite in its own filing for the same quarter: cash orders or in-kind orders, both available. Same sponsor, same asset, two different answers to "did this outflow sell bitcoin".
Three different events print the same red bar
Here are the three, with the tell for each. The worked examples all come from our own daily series.
| Mechanism | What happens to the bitcoin | How to spot it | Worked example |
|---|---|---|---|
| Conversion drain | Sold for cash, then largely re-bought by the funds receiving the money | One legacy fund deeply negative, everything else positive | 22 Jan 2024: GBTC −$640.5m, the other nine funds +$553.1m, category −$87.4m |
| Issuer rotation | Stays in the wrapper business; often just moves wallets under in-kind rules | Two or three funds red, a bigger one green, category flat or positive | 29 Feb 2024: GBTC −$598.9m, rest +$691.2m, category +$92.3m |
| Genuine exit | Sold or delivered out, and nobody in the category buys it back | Nearly every active fund red on the same session | 25 Feb 2025: all eleven active funds negative, category −$1,113.7m |
1. The conversion drain
GBTC existed as a closed-end trust on OTC Markets from 4 May 2015 and uplisted to NYSE Arca on 11 January 2024. For the first time its holders could get out at NAV instead of selling at whatever discount the secondary market offered, and a decade of trapped capital left at once. From the uplisting through 31 July 2024 the fund printed −$18.94bn. Over the whole series it stands at −$27.84bn while every other fund combined is +$84.78bn.
That is not a referendum on bitcoin. It's a decade-old queue clearing, and the money mostly stayed in the category. In 2024 the twelve funds took in +$35.25bn net including GBTC's −$21.50bn, which means everything except GBTC pulled in +$56.74bn that year. Our Grayscale GBTC analysis traces the fee arithmetic that drove it: 1.50% a year against 0.25% at IBIT, on a product holding exactly the same asset.
There's a second conversion artefact worth knowing about. The Grayscale Bitcoin Mini Trust commenced operations on 31 July 2024, seeded out of Grayscale's existing stack. On that session our GBTC column printed zero and the mini printed +$18.0m, with a category total of +$0.3m. A new fund holding thousands of bitcoin appeared and the flow series barely registered it, because no basket was created or redeemed in the ordinary way.
2. Rotation between issuers
GBTC has been negative on 356 sessions. On 196 of them, 55%, the rest of the category was positive on the same day. In 2024 the figure was 136 out of 181, or 75%. Somebody leaving a 1.50% fund for a 0.25% one shows up twice in the data, once as an outflow and once as an inflow, and the underlying bitcoin never leaves the ETF complex. The fund directory lists the fee spread that keeps this trade alive: 0.14% at the cheapest end against 1.50% at the most expensive.
3. A genuine exit
This is the one that deserves attention, and it looks different. On 25 February 2025 all eleven funds trading that day were negative, the category printed −$1,113.7m, and bitcoin fell 4.77%. Nobody was rotating anywhere. In the whole series there are 41 sessions where every active fund (six or more) closed red together, and they average −$437.7m against a −$220.1m average for red days generally.
How many red days were only Grayscale?
This is the cleanest test, so it's worth stating precisely. Take every session where the category total was negative, subtract the GBTC column, and ask whether the remainder is still negative. If it isn't, GBTC alone put the minus sign on the headline.
| Year | Sessions | Red sessions | Red only because of GBTC | Category net flow | GBTC net flow |
|---|---|---|---|---|---|
| 2024 (from 11 Jan) | 245 | 79 (32%) | 28 | +$35.25bn | −$21.50bn |
| 2025 | 250 | 104 (42%) | 5 | +$21.35bn | −$3.76bn |
| 2026 (to 22 Sep) | 181 | 91 (50%) | 3 | +$0.35bn | −$2.59bn |
| All | 676 | 274 (41%) | 36 | +$56.94bn | −$27.84bn |
Thirty-six of 274, and 28 of those fall in 2024, inside the conversion window. Together those 36 sessions printed −$2.83bn as a headline. The GBTC leg was −$8.09bn and everything else was +$5.27bn. Every one of those days was reported as a Bitcoin ETF outflow. On 14 of them bitcoin closed higher.
The honest reading of the whole 2024–2026 record is narrower than the cliché: GBTC is not an excuse for every red day. By 2025 it explained only five of 104, and by 2026 three of 91. The conversion story aged out. What replaced it, in 2026, is a category that simply stopped growing: +$0.35bn across 181 sessions, with half of them red.
The ten biggest outflow sessions, and what caused each
| Date | Category flow | Funds red | Three largest legs | GBTC share | BTC that session |
|---|---|---|---|---|---|
| 25 Feb 2025 | −$1,113.7m | 11 of 11 | FBTC −$345m, IBIT −$164m, ARKB −$126m | 6% | −4.77% |
| 20 Nov 2025 | −$903.2m | 8 of 8 | IBIT −$356m, GBTC −$199m, FBTC −$190m | 22% | −1.30% |
| 13 Nov 2025 | −$866.7m | 9 of 9 | BTC mini −$318m, IBIT −$257m, FBTC −$120m | 7% | −1.48% |
| 29 Jan 2026 | −$817.8m | 8 of 8 | IBIT −$318m, FBTC −$168m, GBTC −$119m | 15% | +0.03% |
| 1 Aug 2025 | −$812.3m | 8 of 8 | FBTC −$331m, ARKB −$328m, GBTC −$67m | 8% | −1.74% |
| 26 Feb 2025 | −$757.8m | 10 of 10 | IBIT −$418m, FBTC −$146m, ARKB −$60m | 3% | −3.40% |
| 27 May 2026 | −$733.4m | 6 of 7 | IBIT −$528m, GBTC −$105m, FBTC −$60m | 14% | −1.81% |
| 21 Jan 2026 | −$708.7m | 6 of 7 | IBIT −$357m, FBTC −$288m, ARKB −$30m | 2% | −4.54% |
| 25 Jun 2026 | −$691.7m | 7 of 8 | FBTC −$274m, IBIT −$266m, ARKB −$82m | 0% | −2.63% |
| 19 Dec 2024 | −$671.9m | 7 of 8 | FBTC −$208m, BTC mini −$189m, ARKB −$108m | 13% | −5.14% |
Two things fall out of that list. First, not one of the ten worst days was a Grayscale story: GBTC's share of the outflow runs from 0% to 22%, and the leg doing the damage is almost always IBIT or FBTC, the two funds that hold 75% of the category's bitcoin. Big outflows come from big funds, which sounds obvious and is routinely forgotten when a headline names GBTC.
Second, every one of these was broad. The narrowest was six red funds out of seven active. That breadth is the signal, and it is separable from the dollar amount, which is why the next two sections treat them apart.
Outflows against price: what the correlation actually is
Pairing every session's flow with bitcoin's move that day gives a Pearson correlation of 0.41. Squared, that's an R² of 0.17: flow travels with about a sixth of the variance in daily price, and five-sixths of it comes from somewhere else. At a weekly frequency the relationship tightens to 0.69, an R² of 0.47, because the noise averages out.
What the correlation does not do is predict. Line the flow up against the price move two sessions later and it falls to 0.08; three sessions later it's −0.02. Flow and price are the same event seen from two angles, not a leading indicator. Flow's own day-to-day autocorrelation is 0.53, which is higher than its link to anything in the price series, so the most reliable thing yesterday's flow tells you is what today's flow will be.
Sorting sessions by the size of the print shows where the relationship lives:
| Category flow that session | Sessions | Average BTC move | Median | Closed higher |
|---|---|---|---|---|
| Below −$500m | 24 | −2.92% | −2.43% | 4% |
| −$500m to −$300m | 42 | −1.69% | −1.34% | 17% |
| −$300m to −$150m | 80 | −0.74% | −0.30% | 40% |
| −$150m to $0 | 128 | −0.62% | −0.93% | 36% |
| $0 to +$150m | 148 | +0.20% | +0.16% | 51% |
| +$150m to +$300m | 102 | +0.82% | +0.61% | 63% |
| +$300m to +$500m | 78 | +1.10% | +1.09% | 67% |
| Above +$500m | 74 | +2.35% | +2.32% | 82% |
The ordering is monotonic, which is real and worth knowing. But look at the middle three rows, which cover 356 of 676 sessions. Between −$300m and +$300m the direction of the day is close to a coin flip, and a −$200m headline carries almost no information about the close. The useful boundary sits near ±$300m, and only 32% of sessions clear it in either direction.
Plenty of individual days break the pattern outright. On 23 sessions the category printed worse than −$150m while bitcoin gained more than 1%: 15 September 2026 (−$450.4m, +1.72%), 14 November 2024 (−$400.7m, +2.35%), 3 February 2026 (−$272.0m, +2.29%). The reverse happens too. On 6 February 2026 the funds took in +$371.1m and bitcoin fell 14.74%, the largest single-session drop in the series. If flow were driving price, that day couldn't exist.
A ruler for the headline number
"$300m of outflows" sounds enormous in isolation and shrinks fast once you attach it to something. At the 30 June 2026 quarter end the twelve funds held 1,210,299 bitcoin worth $71.42bn, from their 10-Q filings. Bitcoin's protocol issues roughly 450 new coins a day at the current 3.125 BTC block subsidy. Here's the same outflow measured four ways, converting at the 22 September 2026 price of $86,416.
| Headline outflow | Bitcoin | Share of the category's stack | Days of new issuance | How often it happens |
|---|---|---|---|---|
| −$100m | 1,157 BTC | 0.10% | 2.6 | 189 sessions, 28% of the series |
| −$300m | 3,471 BTC | 0.29% | 7.7 | 66 sessions, 9.8% |
| −$500m | 5,785 BTC | 0.48% | 12.9 | 24 sessions, 3.6% |
| −$1,113.7m (worst ever) | 12,887 BTC | 1.07% | 28.6 | 1 session, 0.1% |
The median red day, −$160.1m, is about 0.15% of the category's coins. The worst session in 676 removed roughly a hundredth of the stack. Against $71.42bn of assets the same figures are 0.14%, 0.42%, 0.70% and 1.56%, with the caveat that the assets were struck at the June quarter-end price and the coin counts here use September's.
One more piece of perspective on what stays invisible. In the first half of 2026 IBIT sold 1,062 bitcoin, worth $76.5m, purely to pay its 0.25% sponsor fee, and GBTC handed over 1,139.5 bitcoin, worth $84.7m, for its 1.50%. Neither transaction appears anywhere in the flow series, because neither changed the share count. Roughly $161m of bitcoin left those two trusts in six months without a single red bar to mark it.
When an outflow actually matters
Three conditions, in order of how much they tell you.
Duration
The series contains 103 separate runs of consecutive negative sessions. Sixteen of them lasted five sessions or more, and nine lasted seven or more. Those are the ones that coincide with real drawdowns.
| Run | Sessions | Cumulative flow | BTC over the run |
|---|---|---|---|
| 15 May – 3 Jun 2026 | 13 | −$4,361.8m | $79,317 → $66,761 (−15.8%) |
| 17 Jun – 1 Jul 2026 | 10 | −$2,709.8m | $66,310 → $58,625 (−11.6%) |
| 18 – 27 Feb 2025 | 8 | −$3,272.9m | $96,633 → $84,304 (−12.8%) |
| 27 Aug – 6 Sep 2024 | 8 | −$1,185.9m | $64,338 → $56,209 (−12.6%) |
| 24 Apr – 2 May 2024 | 7 | −$1,233.1m | $66,747 → $58,600 (−12.2%) |
| 3 – 11 Mar 2025 | 7 | −$1,568.4m | $84,868 → $78,971 (−6.9%) |
| 18 – 29 Dec 2025 | 7 | −$1,120.9m | $87,823 → $87,963 (+0.2%) |
Six of those seven runs sit alongside a drawdown between 7% and 16%. The December 2025 run is the counterexample, and it's instructive: seven straight red sessions, $1.12bn out, and bitcoin finished 0.2% higher than it started. Duration raises the odds. It doesn't settle them.
Breadth
Count how many funds are red, not how many dollars. Of 274 red sessions, 126 had three or fewer funds negative, and those are usually a rotation or a single lumpy redemption. Only 18 had nine or more red at once. The 41 sessions where every active fund closed negative are the population worth treating as category-wide selling, and their average is twice the size of an ordinary red day.
Outflow while price rises
A red print on a green day is the one combination that carries a distinct message: shares are being redeemed into strength, which is usually profit-taking rather than fear. It happened on 23 sessions with flows worse than −$150m. Treating those as bearish is the most common misread in the whole dataset, and it has the direction backwards.
A five-minute routine for a red day
Open the Bitcoin ETF flows page and work down the list.
- Subtract GBTC. If the remainder is positive, the category bought bitcoin today. Say so.
- Count the red funds. One or two, and it's plumbing. Seven or more, and it's a category event.
- Check the size against the ruler. Under $300m sits inside the range where the day's direction is a coin flip.
- Check the run. A single red session is 41% of all sessions. A fifth consecutive one has happened 16 times in nearly three years.
- Check the price. Outflow plus a rising price is profit-taking, not capitulation.
- Check the trend reading. The CEFI sentiment index smooths the daily series so a one-day spike can't dominate it.
If you're new to the product itself, start with what a Bitcoin ETF is, then how to read Bitcoin ETF flows for the daily mechanics and how to analyse ETF flows for the statistical side. The discount that made GBTC's queue so long in the first place is covered in premium and discount to NAV, and the question of who holds these funds in institutional holders.
How much of this data can you trust?
Fair question, and there's a way to check. Our IBIT column for the six months to 30 June 2026 sums to −$1,838.8m. BlackRock's 10-Q reports net capital share transactions of −$1,838.6m for exactly that period. The two agree to $200,000 across 123 sessions, which is what you'd hope for from a series built on published share counts and NAVs.
Two caveats are worth carrying. Our GBTC column over the same window comes to −$1,853.2m against the filing's −$1,922.2m, a 3.6% gap that comes from dating and NAV conventions rather than missing baskets. And the fund-level asset totals shown elsewhere on the site are static snapshots; for anything cumulative, sum the daily series rather than reading an assets column.
FAQ
Do Bitcoin ETF outflows mean someone sold bitcoin?
Not necessarily. Since the SEC permitted in-kind creations and redemptions on 29 July 2025, a redemption can be settled by delivering bitcoin straight to the authorised participant. BlackRock’s 10-Q shows $5.49bn of IBIT’s $13.88bn of redemptions in the first half of 2026 were paid in kind, or 39.6%, with no market sale. GBTC is the opposite case: its 30 June 2026 10-Q says its authorised participants may only use cash orders, so its redemptions do force sales.
How many Bitcoin ETF outflow days were caused only by Grayscale?
Thirty-six of the 274 red sessions between 11 January 2024 and 22 September 2026. On each of those, removing the GBTC column turns the category total positive. Those 36 days printed −$2.83bn as headlines while everything except GBTC was +$5.27bn. Twenty-eight of them fall in 2024, during the conversion wave; by 2026 only three of 91 red days qualified.
Do Bitcoin ETF outflows correlate with the price falling?
Moderately, and only within the same session. Daily flow and the same-day bitcoin move correlate at 0.41 across 676 sessions, an R² of 0.17. At a weekly frequency it is 0.69. Two sessions ahead the correlation falls to 0.08, so flow has no predictive tail. Sessions between −$300m and +$300m, which is 53% of the series, show close to a coin flip on direction.
How big is a $300m Bitcoin ETF outflow really?
About 3,471 bitcoin at the 22 September 2026 price of $86,416, or 0.29% of the 1,210,299 bitcoin the twelve US funds held at the 30 June 2026 quarter end, and roughly 7.7 days of new issuance at 450 coins a day. It has happened on 66 of 676 sessions, just under 10%. Against the $71.42bn the category held in June 2026 it is 0.42%.
What is the largest single-day Bitcoin ETF outflow on record?
−$1,113.7m on 25 February 2025, when all eleven funds trading that day were negative. Bitcoin fell 4.77%. It is the only session in the series past −$1bn, and the next largest is −$903.2m on 20 November 2025. Grayscale accounted for just 6% of the February 2025 figure; the largest legs were FBTC and IBIT.
When should I take an outflow seriously?
When it lasts, when it is broad, and when it happens on a rising price. Runs of five or more consecutive red sessions have occurred 16 times; the longest, 13 sessions from 15 May to 3 June 2026, removed $4.36bn while bitcoin fell 15.8%. Sessions where every active fund is red, 41 of them, average −$437.7m against −$220.1m for red days generally.
Why did the Grayscale mini trust appearing in July 2024 not show as a flow?
Because no basket was created or redeemed in the ordinary way. The Grayscale Bitcoin Mini Trust commenced operations on 31 July 2024 and listed on NYSE Arca under the ticker BTC, seeded from Grayscale’s existing holdings. On that session our GBTC column printed zero, the mini printed +$18.0m and the category total was +$0.3m. Flow tracks share counts, so a transfer between trusts is close to invisible to it.
Sources and further reading
- SEC press release 2025-101, 29 July 2025: the Commission permits in-kind creations and redemptions for crypto ETPs.
- iShares Bitcoin Trust ETF, Form 10-Q for the quarter ended 30 June 2026: in-kind redemption and creation totals, bitcoin sold to pay expenses, net capital share transactions, 734,261 BTC held.
- Grayscale Bitcoin Trust ETF, Form 10-Q for the quarter ended 30 June 2026: the cash-orders-only language, shares issued and redeemed, 138,505.76 BTC held, the 1,139.51 BTC sponsor fee.
- Grayscale Bitcoin Mini Trust ETF, Form 10-Q for the quarter ended 30 June 2026: commencement of operations on 31 July 2024 and the cash-or-in-kind order language.
- Internal: how to read Bitcoin ETF flows, net flow versus volume, Grayscale GBTC analysis, major Bitcoin ETF funds overview.
For information only. Not investment advice.

 ETH
ETH SOL
SOL XRP
XRP HYPE
HYPE LINK
LINK HBAR
HBAR AVAX
AVAX DOGE
DOGE LTC
LTC SUI
SUI DOT
DOT BNB
BNB NEAR
NEAR TRX
TRX ZEC
ZEC