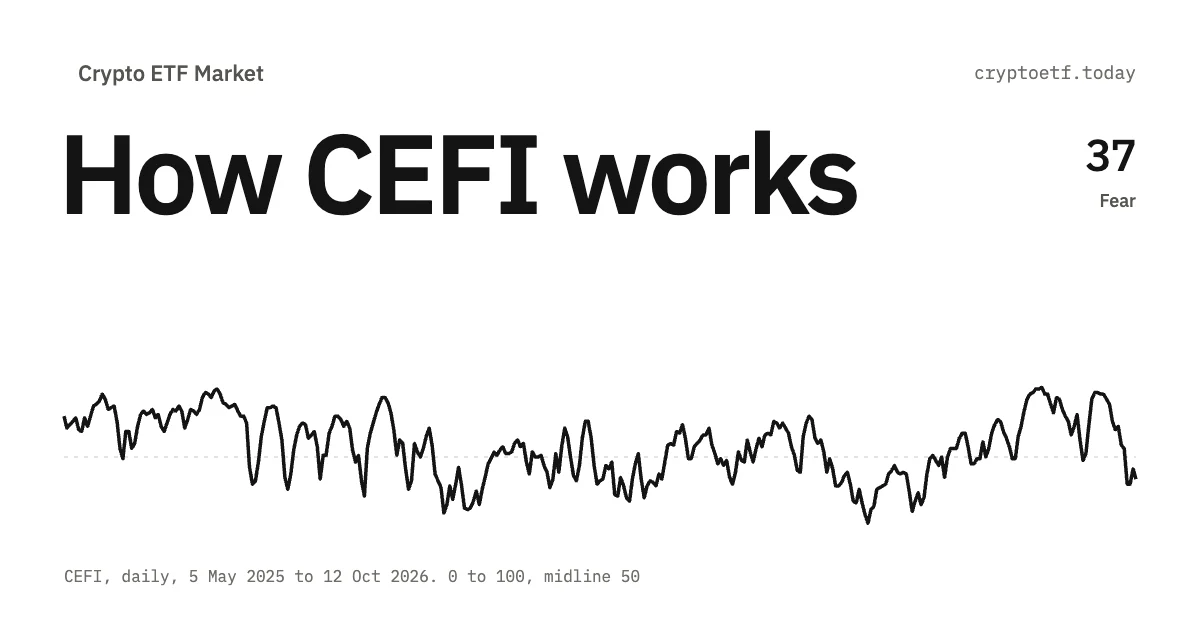
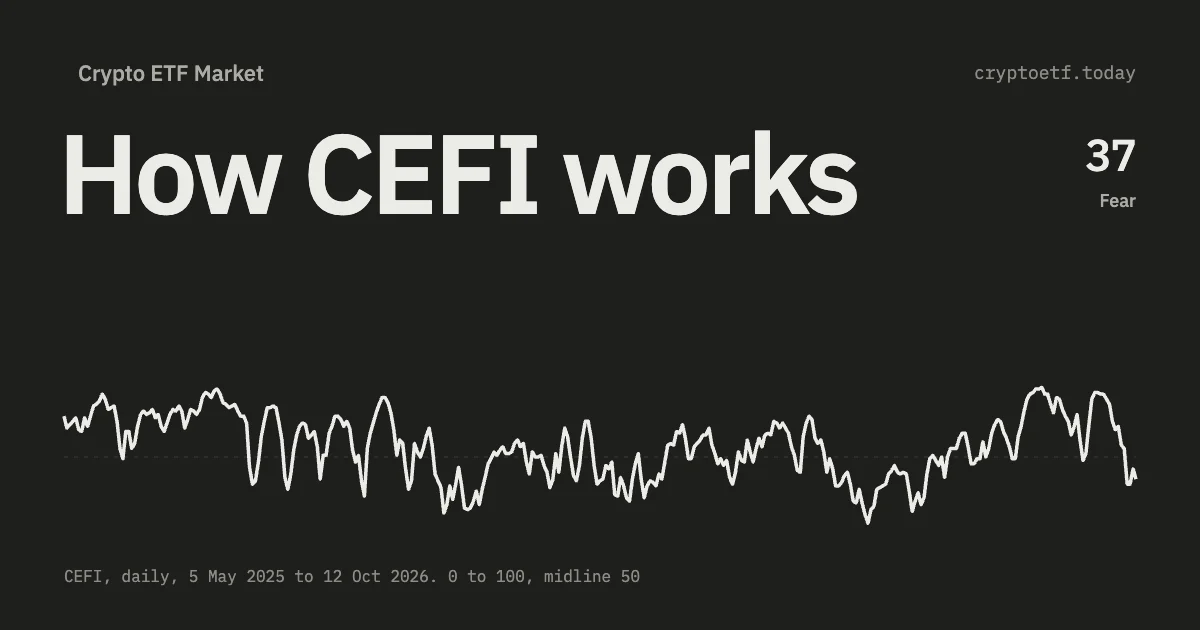
CEFI turns US spot crypto ETF flows into a 0–100 reading where 50 is zero net flow. What its three components measure, how often it hits the extremes, where it misleads.
TL;DR. CEFI is the crypto ETF flow index on this site. It runs from 0 to 100, it covers all 16 assets we track, and it is built from one kind of input only: daily net flow into US spot crypto ETFs. Every trading day the net flows of all funds are added up in dollars and three parts are scored against the past year: today's flow, the 20-day trend and breadth, the share of funds taking in money. Zero net flow scores 50. Across the 706 trading sessions between 11 January 2024 and 2 October 2026 the index closed at 80 or above on 89 of them (12.6%) and at 20 or below on 23 (3.3%); it has never printed 0 or 100. Against bitcoin's forward return the correlation is between +0.09 and +0.15, which is too weak to trade.
Contents · 13 sections
- What the score measures
- How the number is built
- Reading the zones
- Trading days only
- How often the extremes happen, and what follows them
- Does CEFI predict price? Not usefully
- The three components disagree, and that is useful
- Two more things that will surprise you
- What CEFI is not
- How to actually use it
- Where to read the number
- FAQ
- Sources and further reading
Method change, October 2026. From 3 October 2026 CEFI is calculated with a new method, and the whole history was recalculated with it. The previous version scaled each asset's flow by its market capitalisation and gave every asset equal weight, so small new funds could outweigh bitcoin; it compared flow with a 90-day average, so a quiet day after a strong week read as fear; and it counted weekends as days with zero flow. Earlier versions of this page described that method. Everything below describes the calculator that serves the number today.
What the score measures
Raw ETF flow is published as a dollar figure per fund, and a single number for the whole market hides a lot. A $300m day can be one giant fund taking money while ten others lose it. A strong day can come at the end of a month of outflows or in the middle of a run of inflows. And a $300m day in January 2024, when the category was a week old, does not mean what the same number means in 2026.
CEFI puts those three questions into one reading: how big today's flow is, where the last month of flow stands, and how many funds share in it. The site labels it "ETF Flow Sentiment" and the zones borrow fear-and-greed vocabulary, but the resemblance stops at the wording. The classic crypto fear and greed indices blend price momentum, volatility, volume, social media and search interest. CEFI uses none of that, only money moving into and out of regulated spot ETF wrappers.
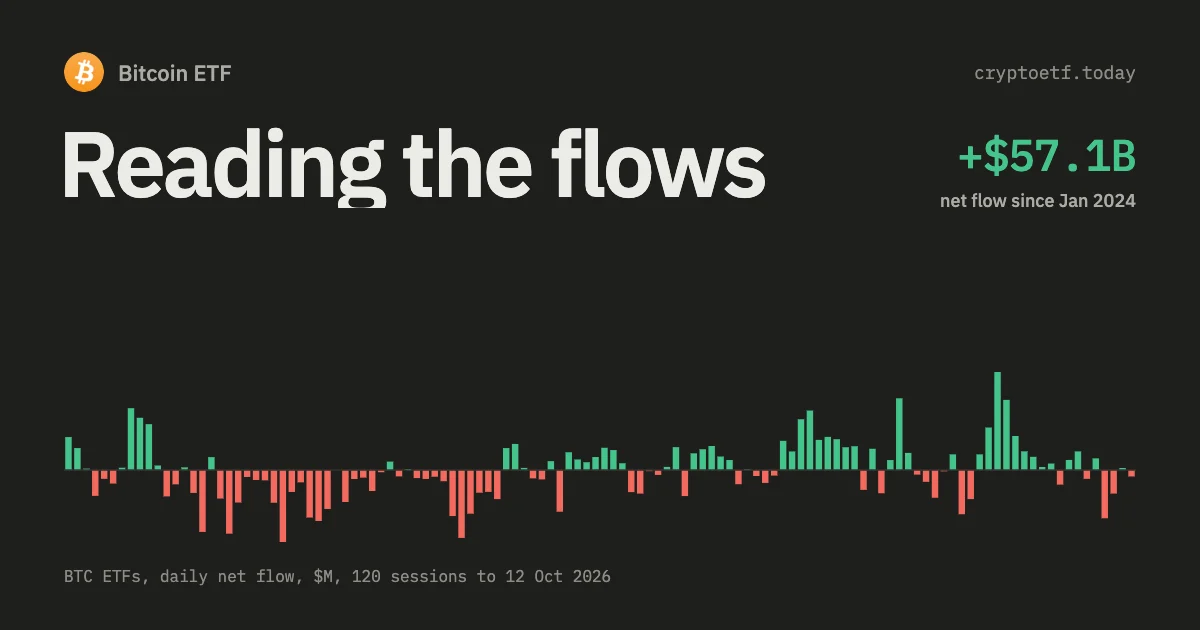
That narrowness is the point. A sentiment poll tells you whether the crowd is excited; flow tells you whether allocators wrote cheques. The gap between those two questions is where CEFI earns its keep, and how to read Bitcoin ETF flows covers where the underlying series comes from.
How the number is built
The calculation has three parts that are scored separately and then averaged.
- One market, in dollars. For every trading day, the net flows of all spot ETFs on all 16 assets are added up in US dollars. Each asset counts in proportion to the money moving through its funds, so bitcoin carries most of the weight and a newly launched fund on a small coin cannot outweigh the rest of the market. Weekends and US market holidays are not in the series at all.
- Three components. Flow is today's net flow, smoothed so that one loud day does not dominate (40% of the index). Trend is the net flow of the last 20 trading days (30%). Breadth is the share of funds with net inflows among the funds that moved money that day (30%).
- Scored against the past year. Each component is compared with its own values over the previous 250 trading days. Zero is 50. Inflows are measured against typical inflow days and outflows against typical outflow days, using the median, so a single record day does not stretch the scale. A typical inflow day scores about 69 and a typical outflow day about 31; the further from typical, the closer to 100 or 0.
- The weighted average. The index is 40% flow, 30% trend and 30% breadth, rounded to an integer. Each component is published on the same 0–100 scale, so you can see which part drives the reading.
There is one CEFI for the whole market, not one per asset. For numbers on a single asset, read its flow page.
Reading the zones
Here is how often the index has been in each zone across the 706 trading sessions from 11 January 2024 through 2 October 2026.
| Score | Zone label | What it usually means | Trading days | Share |
|---|---|---|---|---|
| 0–19 | Extreme Fear | Outflows far larger than a typical outflow day, a weak month, most funds losing money | 19 | 2.7% |
| 20–39 | Fear | Net outflows, or a weak trend that today's flow has not turned | 117 | 16.6% |
| 40–59 | Neutral | Inflows and outflows roughly balance, or the components disagree | 219 | 31.0% |
| 60–79 | Greed | Net inflows on a positive trend | 262 | 37.1% |
| 80–100 | Extreme Greed | Inflows far larger than a typical inflow day, a strong month, most funds taking money | 89 | 12.6% |
The distribution leans to the greed side: the median trading-day reading is 59 and the mean 57.3. That is not a quirk of the formula. US spot crypto ETFs have taken in money on 412 of these 706 sessions and given it back on 277, and an index centred on zero flow reports that. The extremes are rare on both sides. The highest close is 91, on 26 August 2026 (+$462.5m); the lowest is 2, on 27 February 2025, in the middle of the longest outflow run in the series.
Trading days only
US ETFs do not trade on Saturday, Sunday or US market holidays, so there is no flow to report on those dates. The index skips them: the series has a value for every completed trading session and nothing in between.
That was not always so. The previous version of CEFI carried a row for every calendar day and treated the empty weekend as a day of zero flow, which pulled the Saturday reading down by a median of 6 points on no news at all. If you have an old chart with a saw-tooth every weekend, that is where it came from.
One habit still matters. The freshest data point belongs to the last session whose flows have been published, which is usually the previous trading day or the one before it. Read that value, not a guess about today.
How often the extremes happen, and what follows them
| Condition | Trading sessions | Share of sessions |
|---|---|---|
| Index at 80 or above | 89 | 12.6% |
| Index at 90 or above | 7 | 1.0% |
| Index at 20 or below | 23 | 3.3% |
| Index at 15 or below | 14 | 2.0% |
| Index at 10 or below | 13 | 1.8% |
Those 89 Extreme Greed sessions cluster into 20 episodes. The longest ran 14 sessions, from 29 November to 18 December 2024; two more ran nine sessions each, 10–22 July 2025 and 20 August–1 September 2026. The 23 Extreme Fear sessions form six episodes, and one of them dominates: 15 sessions from 24 February to 14 March 2025.
Extremes fade, but slowly. After a close at 80 or above, the index averages 83.2 one session later, 74.5 after five and 69.7 after ten. After a close at 20 or below: 12.9, then 23.5, then 32.7. Neutral 40–59 sessions stay where they are (50.3, 53.6, 53.6). The trend component looks back 20 trading days, so a strong or weak month keeps the index away from 50 for a while after the flow itself has calmed down.
Does CEFI predict price? Not usefully
Getting the alignment right is most of the work here. The flow for session T is published by issuers on the evening of T+1, so the earliest moment you could act on a CEFI reading is session T+2. The table below buys bitcoin at the UTC daily close of session T+2 and measures forward from there, in trading sessions. Windows overlap, so the true confidence intervals are wider than the sample sizes suggest.
| CEFI on session T | Sessions | Mean BTC return, +5 sessions | Mean, +10 sessions | Mean, +20 sessions |
|---|---|---|---|---|
| 80 and above | 80–85 | +0.79% | +2.80% | +6.20% |
| 60–79 | 251–259 | +1.45% | +2.87% | +2.72% |
| 40–59 | 217–219 | +0.46% | +0.83% | +3.10% |
| 20–39 | 117 | −0.62% | −1.31% | +1.02% |
| 19 and below | 19 | +0.98% | +0.67% | −1.24% |
| Every session | 684–699 | +0.70% | +1.46% | +2.84% |
There is a faint tilt and no tradeable edge. Readings of 60 and above did a little better than the average over ten sessions, and the 20–39 bucket did worse, but the order breaks down elsewhere: the Extreme Greed row trails the plain greed row at five sessions, and the Extreme Fear row, with 19 observations from a handful of episodes, beats the average at five. The straight correlation between the reading and the return you could capture is +0.09 at five sessions, +0.15 at ten and +0.11 at twenty. That is the kind of number one strong year can produce on its own.
CEFI is a description of how much money is moving and in which direction, compared with the past year. That is a real and checkable thing to know. It is not a forecast, and the data does not support dressing it up as one.
The three components disagree, and that is useful
The headline number is an average, and averages hide things. The components are published separately so you can see what sits underneath.
| Pair of components | Correlation | Sessions on opposite sides of 50 |
|---|---|---|
| Flow and trend | +0.65 | 167 of 693 (24%) |
| Flow and breadth | +0.71 | 138 of 693 (20%) |
| Trend and breadth | +0.39 | — |
On one session in four, today's flow and the 20-day trend point in opposite directions. That is the moment a run is starting or ending. The session of 2 October 2026 is a clean illustration: net flow of −$11.0m, flow component 59, trend 74, breadth 62, index 64. The month was strong, the day was flat, and most funds still took money. Compare 22 September 2026, when $964.5m came in: flow 96, trend 80, breadth 85, index 88.
Breadth answers a different question from the dollar total. A high flow score with low breadth means one or two large funds carried the day; high breadth with a modest flow score means many funds took small amounts. For the outflow side of that, what Bitcoin ETF outflows actually mean is the companion piece.
Two more things that will surprise you
A negative flow day often prints above 50
Of the 277 trading sessions with negative aggregate net flow, 100 (36%) closed above 50. Of the 412 positive-flow sessions, 60 (15%) closed below it. The asymmetry comes from the trend component: one outflow day in the middle of a strong month leaves the 20-day total positive, and the index stays on the greed side. The correlation between the day's dollar flow and the day's score is +0.66, so the score follows the flow closely, but it is not the same number.
The record days make the point. The largest single-session inflow, $1,558.7m on 10 July 2025, scored 85; the largest outflow, $1,163.8m on 25 February 2025, scored 6.
New funds no longer move the index on their own
Because flows are added up in dollars, a newly listed asset adds only the money that actually goes into its funds. Ether ETFs began trading on 23 July 2024; the index printed 74 that day on aggregate net flow of +$28.6m, down from 77 the day before. Litecoin and Hedera ETFs joined on 28 October 2025, a day of +$517.9m, and the index read 69. In the previous version each launch produced a jump to 99 or 100 for mechanical reasons.
The level still changes between eras, and that reflects the money. The average trading-day reading is 61.7 for the bitcoin-only period, 60.0 from the ether launch to October 2025, and 51.2 since then, a stretch that includes the heavy outflows of November 2025.
What CEFI is not
- Not a price forecast. Correlation with the tradeable forward return is +0.09 to +0.15. See above.
- Not a buy or sell signal. Nothing in the calculation models risk or position sizing, and this site doesn't give investment advice.
- Not real time. Issuer disclosure lands the evening after the session. Today's reading is tomorrow's news.
- Not a measure of holdings. Flow is the change, not the level. A complex can post weak flow while holding record assets.
- Not sentiment in the survey sense. It measures cheques written through a regulated wrapper. Retail can be euphoric on social media while the score sits at 30.
- Not complete. It covers US spot ETFs on 16 assets. Offshore ETPs, futures products, trusts outside the tracker and direct spot buying are all invisible to it.
How to actually use it
Three framings survive the data above.
- Check a narrative against the tape. When a headline says institutions are capitulating and the index is at 72, one of the two is wrong, and the flow series is auditable. This is what the score is genuinely good at.
- Read the components, not just the level. A gap between flow and trend tells you a run is starting or fading; low breadth under a high flow score tells you the move rests on a few funds. On 2 October 2026 a trend of 74 against a flow of 59 said more than the index's 64.
- Treat extremes as context, not triggers. Only 3.3% of sessions have closed at 20 or below, which tells you where today sits in the distribution. It doesn't tell you what comes next.
Threshold trading rules don't hold up. The forward-return table has no edge to harvest, and anyone backtesting one should align on T+2 before believing the result.
Where to read the number
The current index, its three components and its history, with zone bands, sit on the crypto ETF sentiment index page. The series is available at GET /api/cefi/composite and, for developers, at GET /api/v1/index/cefi with the components of the current day; every count in this article came from that series, so you can reproduce it. For wider context, start with what a Bitcoin ETF actually is.
FAQ
What is the CEFI index?
CEFI is the crypto ETF flow index on cryptoetf.today. It turns daily net flow into US spot crypto ETFs across 16 assets into a single 0-100 reading where 50 means zero net flow, 80 and above is Extreme Greed and 20 and below is Extreme Fear. It uses flow data only, with no price, volatility or social media input.
How is CEFI calculated?
Every trading day the net flows of all funds on all 16 assets are added up in US dollars. Three components are scored against the previous 250 trading days: today's flow, smoothed (40%), the net flow of the last 20 trading days (30%) and breadth, the share of funds with inflows (30%). Zero flow scores 50; a typical inflow day about 69 and a typical outflow day about 31.
What does a CEFI reading of 80 mean?
It means inflows are well above a typical inflow day, the last month of flow is strongly positive and most funds are taking money. Across 706 trading sessions from January 2024 to 2 October 2026 the index closed at 80 or above on 89 of them, roughly one session in eight.
Does the CEFI index predict bitcoin price?
Not usefully. Aligning the reading for session T against the earliest return you could capture, starting at session T+2, gives a correlation of +0.09 over five sessions, +0.15 over ten and +0.11 over twenty. That is too weak to trade. Treat CEFI as a description of current flow, not a forecast.
Why did the CEFI history change in October 2026?
On 3 October 2026 the index moved to a new method and the whole history was recalculated. Flows are now added up in dollars instead of being scaled by each coin's market capitalisation, zero flow is the neutral point instead of a 90-day average, and weekends are no longer counted as days of zero flow. Old readings and charts will not match the new series.
Is there a separate CEFI index for each asset?
No. CEFI is a single index for the whole US spot crypto ETF market across 16 assets. Each asset counts in proportion to the money moving through its funds. For numbers on one asset, open that asset's flow page.
Can a day with ETF outflows still score above 50?
Yes. The trend component looks back 20 trading days, so a single outflow day in the middle of a strong month can leave the index on the greed side. Of 277 negative-flow sessions, 100 closed above 50. The correlation between the day's dollar flow and the day's score is +0.66.
Sources and further reading
- SEC, Release 34-99306, order approving spot bitcoin ETPs, 10 January 2024 — the start date of our flow series. sec.gov
- SEC, Release 34-100224, order approving spot ether ETPs, 23 May 2024; trading began 23 July 2024. sec.gov
- NYSE holidays and trading hours, the calendar behind the trading-day series. nyse.com
- Alternative.me Crypto Fear and Greed Index, the price-and-volatility-based index CEFI is often confused with. alternative.me
- CNN Business Fear and Greed Index, the equity-market original the zone vocabulary borrows from. cnn.com
For information only. Not investment advice.

 BTC
BTC ETH
ETH SOL
SOL XRP
XRP HYPE
HYPE LINK
LINK HBAR
HBAR AVAX
AVAX DOGE
DOGE LTC
LTC SUI
SUI DOT
DOT BNB
BNB NEAR
NEAR TRX
TRX ZEC
ZEC