Volume counts shares changing hands. Net flow counts bitcoin entering or leaving the trust. On 22 September 2026 the twelve US spot funds traded $2.39bn and created $714.7m of shares. Here is the arithmetic behind the gap.
TL;DR. Volume is shares changing hands between investors on the exchange. Net flow is shares being created or destroyed by the issuer, which is the only thing that moves bitcoin in or out of the trust. On 22 September 2026 the twelve US spot Bitcoin ETFs turned over $2,390.3m of stock and booked $714.7m of net creations, a conversion rate of 29.9% that was the highest of the previous month. Across the 22 sessions from 18 August to 22 September 2026 the same twelve funds traded $65.76bn and created a net $4.04bn, or 6.1%, and 138 of 264 fund-days showed exactly zero flow while every one of those funds traded. Volume and flow aren't even bounded by each other: Morgan Stanley's MSBT printed $99.0m of creations on $56.0m of turnover.
Contents · 9 sections
- Two numbers that get printed side by side and mean different things
- One session, twelve funds
- Why they diverge: the basket, not the tape
- The conversion ratio, fund by fund
- Flow, volume and AUM answer three different questions
- How this breaks the way headlines get read
- A routine that uses both numbers
- FAQ
- Sources and further reading
 Bitcoin ETFsNet flow Fri 16 Oct−$82.4M
Two numbers that get printed side by side and mean different things
Every headline about Bitcoin ETFs uses one of two numbers, and they're rarely labelled clearly enough to tell apart.
Volume is the exchange tape. Shares of IBIT, FBTC or GBTC change hands between one investor and another, the exchange records each print, and at the close you get a share count. Multiply that by the closing price and you have dollar turnover. It arrives in real time, it's free, and your broker shows it next to the price.
Net flow is the primary market. An Authorized Participant delivers bitcoin or cash to the trust and receives a block of new shares, or hands back a block of shares and receives bitcoin or cash. Creations minus redemptions, valued at that day's NAV, is the net flow. It's published by the issuer after the close and it's the only number that tells you whether the trust holds more bitcoin tonight than it did last night.
The confusion is easy to make because both come out in dollars, both are daily, and both spike on the same exciting days. They answer different questions: volume answers "how easily can I get in and out", flow answers "did anyone actually buy". The mechanics of the second one are in how Authorized Participants work; the reading method is in how to analyze ETF flows. This article is about the gap between them, measured.
One session, twelve funds
Here's a single trading day taken apart. Turnover is the regular-session share volume (13:30 to 20:00 UTC) multiplied by the last regular-session print. Flow is the issuer-reported net creation for the same date. Both come from our own data for 22 September 2026, the most recent complete session at the time of writing.
| Fund | Shares traded | Close | Turnover | Net flow | Flow ÷ turnover |
|---|---|---|---|---|---|
| IBIT (BlackRock) | 37,240,241 | $48.82 | $1,818.1m | +$350.3m | 19.3% |
| FBTC (Fidelity) | 3,951,256 | $75.04 | $296.5m | +$257.4m | 86.8% |
| GBTC (Grayscale) | 1,261,443 | $66.65 | $84.1m | $0.0m | 0.0% |
| MSBT (Morgan Stanley) | 2,265,389 | $24.73 | $56.0m | +$99.0m | 176.7% |
| BTC (Grayscale Mini) | 1,354,298 | $38.12 | $51.6m | +$5.0m | 9.7% |
| BITB (Bitwise) | 655,886 | $46.78 | $30.7m | $0.0m | 0.0% |
| ARKB (ARK 21Shares) | 1,067,009 | $28.58 | $30.5m | +$0.6m | 2.0% |
| HODL (VanEck) | 488,364 | $24.38 | $11.9m | +$2.4m | 20.2% |
| EZBC (Franklin) | 152,686 | $49.82 | $7.6m | $0.0m | 0.0% |
| BTCO (Invesco) | 24,076 | $85.73 | $2.1m | $0.0m | 0.0% |
| BRRR (CoinShares) | 35,131 | $24.30 | $0.9m | $0.0m | 0.0% |
| BTCW (WisdomTree) | 4,081 | $91.10 | $0.4m | $0.0m | 0.0% |
| All twelve | $2,390.3m | +$714.7m | 29.9% |
Source: our own flow series and five-minute price data for 22 September 2026, read 23 September 2026. Read the rows rather than the total. Five of the twelve funds traded between $0.4m and $84.1m of stock and created nothing at all. GBTC alone shows $84.1m of turnover against a flat share count, which is the cleanest possible demonstration that the two numbers are unrelated: somebody sold Grayscale shares, somebody else bought them, and the trust's bitcoin never moved.
Why they diverge: the basket, not the tape
The trust doesn't watch the tape. It watches its transfer agent. An issuer only gains or loses bitcoin when an Authorized Participant submits a creation or redemption order in whole baskets. BlackRock's FY2025 Form 10-K defines an IBIT basket as a block of 40,000 shares, which at 22 September's $48.82 close was worth about $1.95m. IBIT's +$350.3m that day is therefore roughly 179 baskets, about 7.2 million new shares, against 37.2 million shares traded. That single ratio explains the whole article: four out of five IBIT shares that changed hands that day already existed.
The secondary market is where existing shares circulate. Investor A sells 1,000 shares and Investor B buys them. Volume rises, flow doesn't change, and the trust's bitcoin balance is identical at the close. Creation and redemption only get triggered when the share price drifts far enough from NAV for an AP to profit by closing the gap, which is the arbitrage described in premium and discount to NAV. On a quiet day nobody bothers.
The redemption that never touched a screen
There's a second reason the numbers don't line up, and it surprises people: flow isn't a subset of volume. A creation or redemption is a private transaction between an AP and the trust. It can be settled in kind, bitcoin against shares, without a single share trading on an exchange. BlackRock's FY2025 10-K reports $5,764,499,490 of bitcoin purchased in kind for shares issued and $845,454,277 of bitcoin paid in kind for shares redeemed during 2025. None of that had to print on Nasdaq.
So flow can exceed turnover, and regularly does in smaller funds. MSBT did it twice in two days: +$61.7m on $27.0m of turnover on 21 September, then +$99.0m on $56.0m on the 22nd. ARKB's 10 September 2026 session is the extreme case in our window, a redemption of $164.3m against $18.0m of regular-session turnover, roughly nine times the tape. Somebody exited a position in size without ever offering shares to the market.
The conversion ratio, fund by fund
If flow and volume are different quantities, their ratio is a real metric rather than a rounding artefact. Call it the conversion ratio: gross creations plus redemptions, in absolute dollars, divided by dollar turnover over the same window. It answers a question no aggregator publishes, which is how much primary-market activity each fund generates per dollar of secondary trading.
Below is every US spot Bitcoin ETF over the 22 sessions from 18 August to 22 September 2026. The window is set by our price history: 22 sessions is the longest span for which all twelve funds have complete regular-session data, so every fund is measured on identical days.
| Fund | Turnover, 22 sessions | Gross flow | Net flow | Conversion | Zero-flow days |
|---|---|---|---|---|---|
| ARKB | $1,110.0m | $1,036.9m | +$118.9m | 93.4% | 8 of 22 |
| MSBT | $379.3m | $245.4m | +$245.4m | 64.7% | 5 of 22 |
| FBTC | $6,165.6m | $1,407.0m | +$516.0m | 22.8% | 4 of 22 |
| BITB | $1,257.4m | $273.4m | +$124.1m | 21.7% | 5 of 22 |
| BTCW | $24.8m | $5.2m | −$5.2m | 21.0% | 21 of 22 |
| HODL | $520.8m | $100.0m | −$64.0m | 19.2% | 11 of 22 |
| BTC (Mini) | $1,659.8m | $214.8m | +$214.8m | 12.9% | 10 of 22 |
| GBTC | $2,778.5m | $358.0m | −$292.5m | 12.9% | 11 of 22 |
| BTCO | $68.6m | $8.3m | −$1.1m | 12.1% | 20 of 22 |
| IBIT | $51,620.3m | $4,381.0m | +$3,173.7m | 8.5% | 0 of 22 |
| EZBC | $155.9m | $5.9m | +$5.9m | 3.8% | 21 of 22 |
| BRRR | $20.6m | $0.0m | $0.0m | 0.0% | 22 of 22 |
| All twelve | $65,761.5m | $8,035.8m | +$4,036.0m | 12.2% | 138 of 264 |
Source: our flow series and five-minute candles, 18 August to 22 September 2026, read 23 September 2026. Four things fall out of the table.
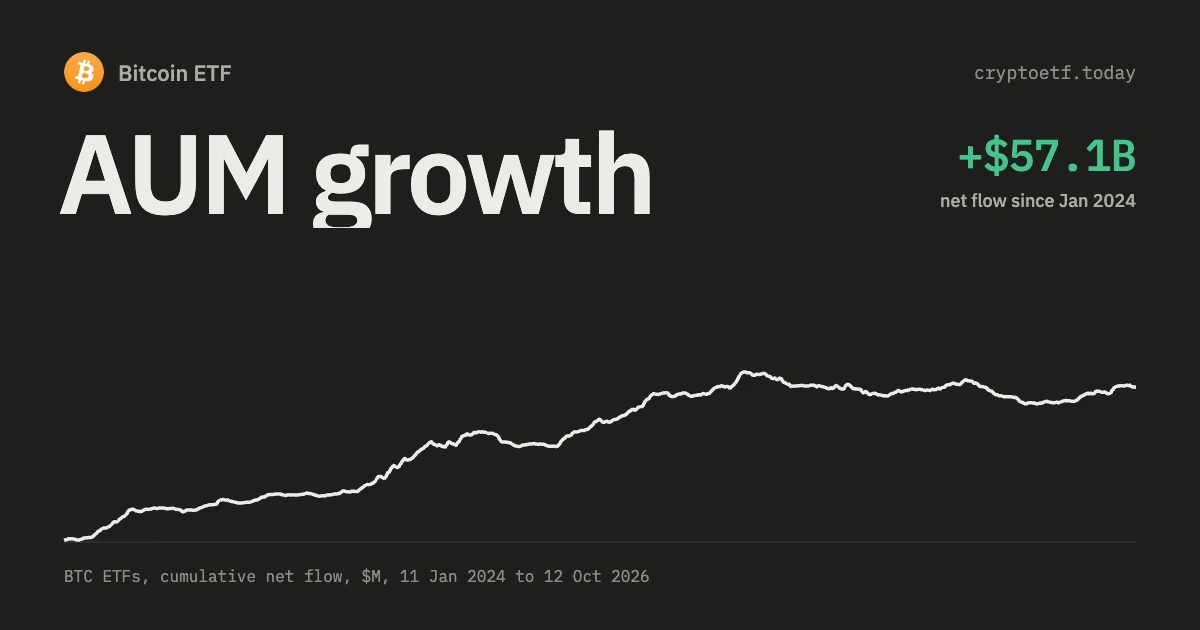
- The category is mostly churn. $65.8bn of stock traded to move $8.0bn in and out of the trusts. Put differently, the tape over these 22 sessions is larger than the $56.9bn of cumulative net flow the whole category has accumulated across 676 sessions since 11 January 2024.
- Over half of all fund-days are flat. 138 of 264 fund-days had exactly zero creations and zero redemptions, and on every one of those days the fund still traded. BRRR traded all 22 sessions and never once moved a basket.
- Size and conversion run in opposite directions. IBIT is 78.5% of the category's turnover but only 54.5% of its gross flow. Its conversion of 8.5% is the second lowest in the table, which is what a mature, heavily traded instrument looks like: enormous secondary liquidity sitting on top of a slower primary market. ARKB and MSBT are the reverse, thin tapes with block-sized primary orders behind them.
- Direction and activity are separate readings. GBTC and the Grayscale Mini Trust have almost the same conversion, 12.9% each, and opposite signs: −$292.5m against +$214.8m. Conversion measures how busy the primary market is, not which way it's pointing.
You can rebuild any row of this table yourself from the daily series on the Bitcoin ETF flows page.
Flow, volume and AUM answer three different questions
The third number in the mix is assets under management, and it's the one most often used as a proxy for the other two. It isn't one. AUM is a stock, flow is the change in that stock caused by investors, and volume is unrelated to either.
| Trading volume | Net flow | AUM | |
|---|---|---|---|
| What it measures | Shares changing owner on an exchange | Shares created or destroyed by the trust | Bitcoin held × price, minus accrued fees |
| Where it comes from | Exchange tape (Nasdaq, NYSE Arca, Cboe) | Issuer share count and NAV, after the close | Issuer daily fund page, struck at the NAV time |
| How often it updates | Continuously during the session | Once per trading day, usually that evening | Once per trading day |
| Moves when the price moves? | Usually, but not mechanically | No | Yes, one for one on the holdings |
| Good for | Execution quality, spreads, order sizing | Direction of investor demand | Fund scale, fee revenue, index weight |
| Can't tell you | Whether anyone bought bitcoin | Whether you can trade the fund cheaply | Whether growth came from inflows or price |
| Bounded by the others? | No | No, it can exceed volume | No |
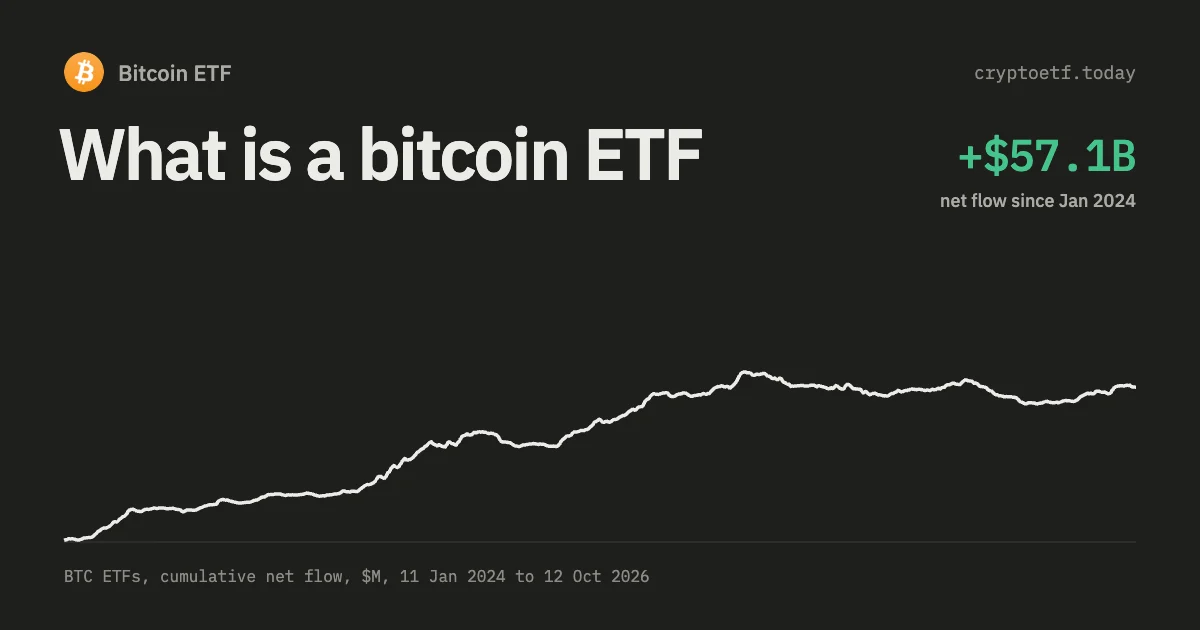
The last row of "can't tell you" is where most analysis goes wrong. A fund's AUM can rise 40% in a quarter with net redemptions the whole way, purely because bitcoin appreciated. Our own series makes the point: since 11 January 2024 the category has taken in $56.94bn of net flow while bitcoin went from $46,563 to $86,416, so most of the reported asset growth is price, not purchases. The split between the two is the subject of the AUM growth analysis, and the fund-level view sits in the funds overview.
How this breaks the way headlines get read
"Record trading volume in Bitcoin ETFs" is a sentence about market makers. It says nothing about whether money came in. Three sessions from our window show how far apart the two can sit.
| Session | Category turnover | Net flow | Gross flow | Conversion | BTC close |
|---|---|---|---|---|---|
| 19 Aug 2026 | $6,468.0m | +$517.2m | $517.2m | 8.0% | $64,725 |
| 11 Sep 2026 | $2,260.3m | −$13.3m | $25.2m | 1.1% | $76,569 |
| 15 Sep 2026 | $3,880.5m | −$450.4m | $450.4m | 11.6% | $78,167 |
| 22 Sep 2026 | $2,390.3m | +$714.7m | $714.7m | 29.9% | $86,416 |
Source: our flow series and price data, read 23 September 2026.
19 August: the biggest tape of the month, an ordinary flow day
$6.47bn of turnover, the heaviest of the 22 sessions and more than double the $2.99bn average, produced $517.2m of creations. That's an 8.0% conversion, below the window's 12.2%. A volume-only reading would have called this the most significant day of the month. In primary-market terms it ranked fifth.
11 September: $2.26bn traded, nothing created
Nine of the twelve funds registered exactly zero flow. IBIT traded $1,794.8m and booked −$19.2m. The category's gross primary activity for the entire session was $25.2m, a conversion of 1.1%, the lowest of the window. Bitcoin moved, the tape was busy, and the trusts held effectively the same coins at the close as at the open.
15 September: heavy volume, the biggest outflow of the month
This is the case that matters for headline reading. $3.88bn of turnover, third highest in the window, alongside −$450.4m of net flow, the largest single-day redemption of the period. FBTC gave back $214.8m, IBIT $161.7m, GBTC $44.1m. Bitcoin still closed at $78,167, up on the day. Any story built on "elevated ETF volume" would have described this session as strong demand. It was the opposite, and only the flow number said so. What a redemption day does and doesn't imply is covered in what Bitcoin ETF outflows actually mean.
Price and flow disagree more often than most people assume. In our 22-session window, bitcoin's daily direction and the category's net flow had opposite signs on 7 of 21 comparable days.
A routine that uses both numbers
Neither series is a signal on its own. A workable order of operations:
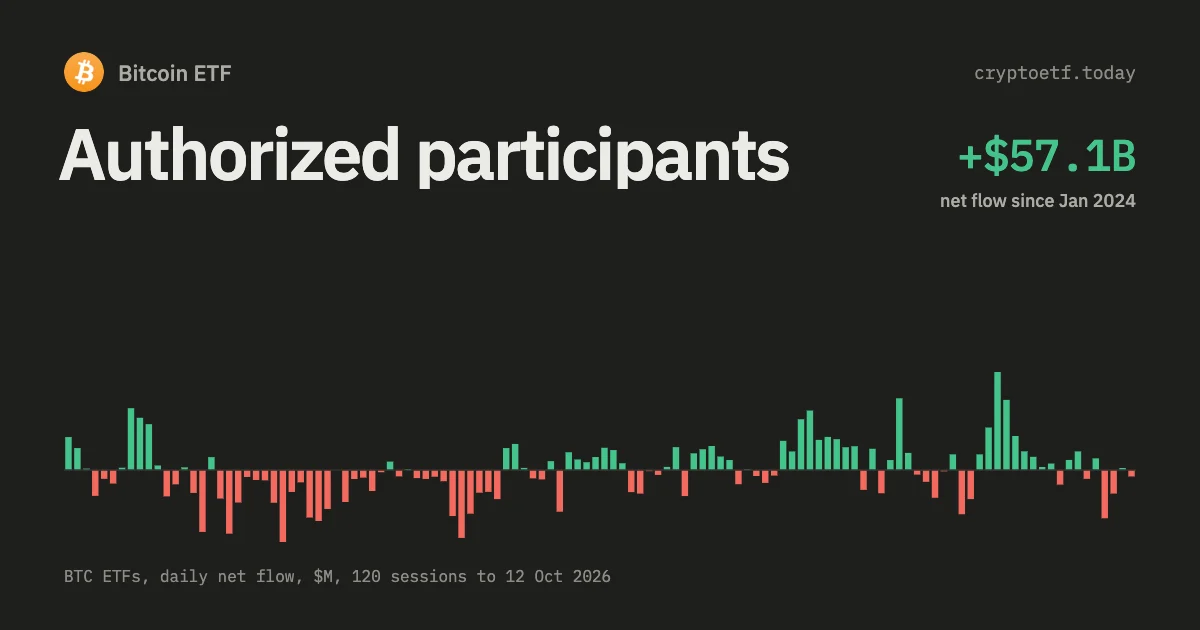
- Start with net flow, not volume. Read the 5-session sum rather than a single print. One day is one large allocator; a week is a trend. The per-day detail is on the flows page and the cross-asset view is on the dashboard.
- Check the conversion ratio for regime, not direction. Sustained readings above roughly 20% mean the primary market is busy and new capital is arriving or leaving in size. Readings near the 12% baseline, or below it, mean you're mostly watching investors trade with each other.
- Split by fund before drawing conclusions. IBIT carries 78.5% of the tape, so a category-level volume spike is usually an IBIT story. Flow is far less concentrated, and a day where Fidelity and Morgan Stanley move while BlackRock is flat means something different from the reverse.
- Use volume only for execution questions. Spread, market impact, whether a limit order will fill. A fund with $0.4m of daily turnover like BTCW is a different trade from one with $1.8bn, regardless of what either is doing in the primary market.
- Never infer AUM change from either. Take the issuer's published net assets. Price does most of the work, and fees quietly subtract from bitcoin per share every day.
Step-by-step reading of the flow table itself, including the T+1 timing and what the weekend blanks mean, is in how to read Bitcoin ETF flows. If you're new to the wrapper, start from what a Bitcoin ETF is.
FAQ
What's the difference between Bitcoin ETF volume and net flow?
Volume is the dollar value of shares changing hands between investors on the exchange, and it leaves the trust untouched. Net flow is the dollar value of shares created minus shares redeemed by Authorized Participants, which is the only mechanism that adds or removes bitcoin from the fund. Across the 22 US sessions from 18 August to 22 September 2026, the twelve spot funds traded $65.76bn and produced $8.04bn of gross creations and redemptions, so roughly 88% of the tape was investors trading with each other.
Why is volume usually much larger than net flow?
Because shares already in circulation can be bought and sold indefinitely without the issuer being involved. A creation or redemption only happens when the share price drifts far enough from NAV that an Authorized Participant can profit by closing the gap, and it has to be done in whole baskets. BlackRock’s IBIT basket is 40,000 shares, about $1.95m at the 22 September 2026 close, so small imbalances simply never trigger one.
Can net flow be bigger than trading volume?
Yes, and it happens regularly in smaller funds. Creations and redemptions are private transactions between an Authorized Participant and the trust, often settled in kind, and they never have to print on an exchange. Morgan Stanley’s MSBT recorded +$99.0m of net creations on $56.0m of regular-session turnover on 22 September 2026. ARKB booked a $164.3m redemption on $18.0m of turnover on 10 September 2026.
What does it mean if Bitcoin ETF volume is high but net flow is near zero?
It means the day was secondary-market activity with no change in the trusts’ bitcoin holdings. On 11 September 2026 the twelve funds traded $2,260.3m while nine of them recorded exactly zero flow and the category netted −$13.3m. That pattern is normal around options expiries, index rebalancing and macro headline days, when positions rotate between existing holders.
Which is the better demand signal: volume or net flow?
Net flow, for anything to do with capital direction. It is the only one of the two that tracks bitcoin entering or leaving the wrapper. Volume is the better number for execution questions such as spreads, order sizing and market impact. Reading a volume headline as a demand signal is the single most common mistake in Bitcoin ETF coverage.
Does rising AUM mean money is flowing into a Bitcoin ETF?
Not necessarily. AUM is bitcoin held multiplied by price, less accrued fees, so it rises on price alone. Since launch on 11 January 2024 through 22 September 2026, the US spot category took in $56.94bn of cumulative net flow while bitcoin went from $46,563 to $86,416, which means a large share of the reported asset growth came from appreciation rather than purchases. Grayscale’s GBTC has lost $27.84bn to net redemptions over the same period and still holds a substantial book.
Where can I see Bitcoin ETF net flow data?
Each issuer publishes its daily share count and NAV, usually that evening, and the flow is the change in shares valued at NAV. Our Bitcoin ETF flows page rebuilds the per-issuer table for every session since 11 January 2024, 676 of them as of 22 September 2026. Volume is different: it comes off the exchange tape in real time and is in any market-data terminal or broker screen.
Sources and further reading
- iShares Bitcoin Trust ETF, Form 10-K for 2025 (filed 27 February 2026). The 40,000-share basket definition, the in-kind creation and redemption totals for 2025 ($5,764,499,490 and $845,454,277), and 1,352,920,000 shares outstanding as of 30 January 2026.
- SEC Release 34-99306 (10 January 2024). The order approving the spot Bitcoin ETPs, including the creation and redemption mechanics that net flow measures.
- SEC investor.gov, mutual funds and ETFs. The primary versus secondary market distinction in plain language.
- Cboe US Equities market statistics. Where exchange volume is published, and a reminder that consolidated tape volume is split across venues.
- EDGAR full-text search. Each trust’s 10-K, 10-Q and 8-K filings, for basket sizes, shares outstanding and fee changes.
- Daily data: Bitcoin ETF flows and the multi-asset dashboard. Internal: how to read Bitcoin ETF flows, what outflows mean, Authorized Participants, how to analyze ETF flows.
For information only. Not investment advice.

 ETH
ETH SOL
SOL XRP
XRP HYPE
HYPE LINK
LINK HBAR
HBAR AVAX
AVAX DOGE
DOGE LTC
LTC SUI
SUI DOT
DOT BNB
BNB NEAR
NEAR TRX
TRX ZEC
ZEC