 BlackRock





Compare up to 4 funds
Put any four funds on one chart and see how they diverge over time.
Daily inflows and outflows for all 58 US spot crypto ETFs across 16 assets — with issuer cost basis, a sentiment index, reports and alerts. Free to start.
 BTC ETFs
A spot ETF holds the actual coin. When investors buy more shares than they sell, an authorized participant creates new shares and the fund buys the underlying asset to back them. When shares are redeemed, the process runs in reverse and coins are released. The daily flow is the net of that, in dollars, published fund by fund.
That makes ETF flows one of the few public, daily, fund-level records of institutional demand for crypto — and the reason the app exists.
Price tells you what happened. Flow tells you who did it.
Open the app and the day is already summarised: total assets under management, today’s net flow, the last five sessions and the year to date, with a badge showing when the numbers were last updated. A cumulative chart shows every dollar that has entered or left since January 2024, switchable by asset.
Every asset has its own page with the coin price, a 30-day flow chart and a fund-by-fund breakdown. Tap or drag a bar. Every day, every fund.
For every fund the app estimates the average price its investors paid — a weighted average of all daily inflows since launch — and compares it with today’s market price. The result is one number per fund: how far its clients are above or below water.
All 58 funds from every issuer, grouped three ways: by issuer, as one flat list, or by asset. Filter by coin, sort by AUM, fee or name, and open any fund for its AUM, fee, NAV and the complete daily flow history since its first trading day.
The Crypto ETF Flow Index (CEFI) is a composite sentiment score from 0 to 100 built from institutional spot-ETF flows. It is a dimensionless index — not a dollar amount. Higher = stronger net inflows (risk-on); lower = net outflows (risk-off).
Every exchange-listed ticker, ranked by daily volume, with price, 24-hour change and a 30-day sparkline. Filter by asset, star what you follow, and open any ticker for its chart and the sibling ETFs that hold the same coin.
A daily flow digest every morning, before the US open, plus alerts when a fund moves a lot in one day. Skip quiet days: alert only when a daily flow crosses the amount you choose.
Put the day’s flows on your Home Screen without opening the app: small, medium and large widgets, plus a Lock Screen widget. Choose which assets appear and in which order.
BTC ETFs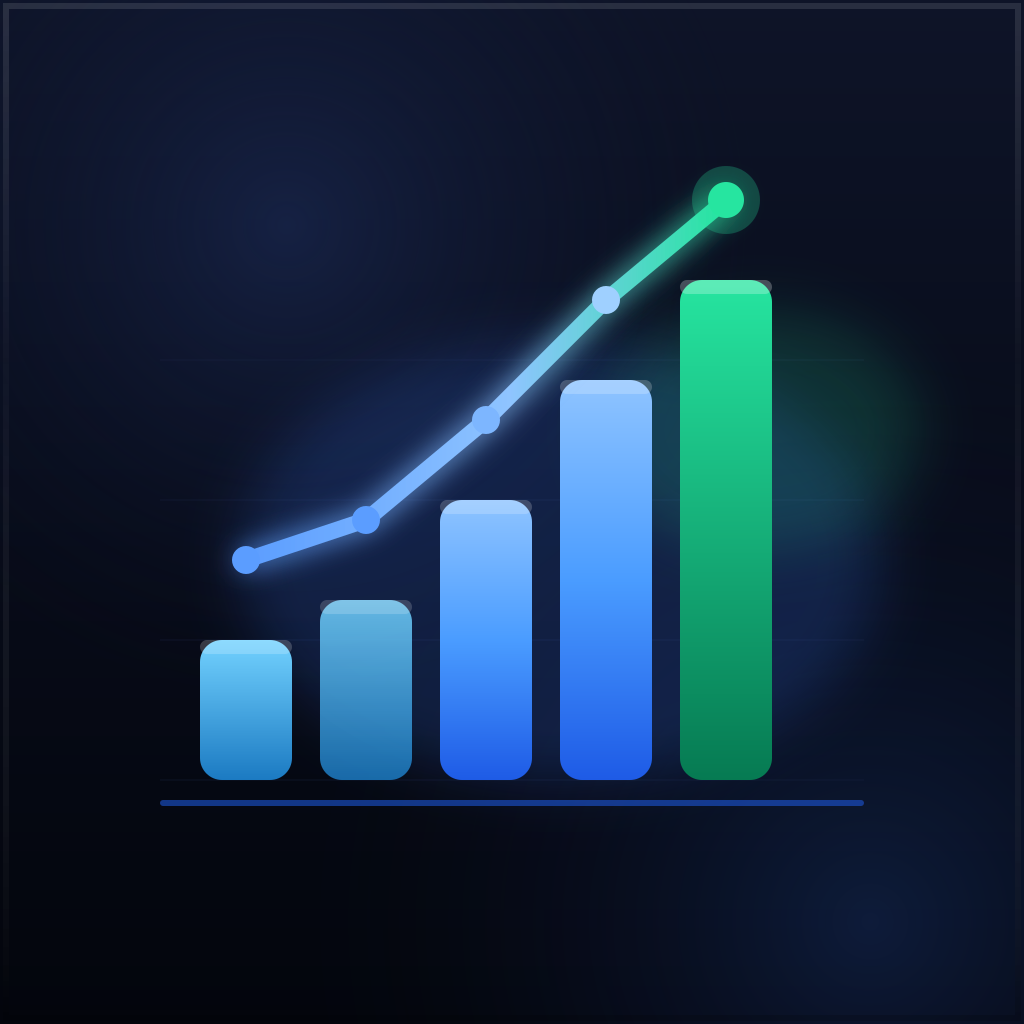 Crypto ETFsOCT 16BTC
 ETH
 SOLCrypto ETFsOCT 16BTCBitcoin−$82.4M$104.44BETHEthereum−$69.7M$15.08BSOLSolana−$12.7M$1.61B
 XRPXRP−$2.5M$1.47B
 HYPEHyperliquid+$0.0M$0.41B
Ask in plain language — “Which ETF had the biggest inflow this week?” — and get an answer built from the last 30 days of our data, with the numbers in it. Six starter questions help you begin. Sign in with a free account to ask five questions a day.
For when one day’s number isn’t enough.
Put any four funds on one chart and see how they diverge over time.
Filter by AUM range, flow direction, max fee, premium/discount and inflow streak — or start from a preset.
The full flow history of any fund, day by day since launch, with CSV export.
Star any ticker to follow it. Add ETF positions and see balance and gain/loss — synced with cryptoetf.today. Record each purchase or sale by hand with price and date; the app tracks value, cost basis, realised and unrealised gain or loss.
Each day’s numbers are written up as a short report, with weekly and monthly recaps on top. The blog goes deeper, bookmarks keep what you want to reread, global search finds any fund, ticker or article, and a built-in glossary explains NAV, AUM, creation units, premium/discount and the rest.
The value of a fund’s holdings per share, calculated once a day after the market closes.
Unedited captures from the iPhone app, version 4.0, October 2026. They follow the site theme, light or dark.
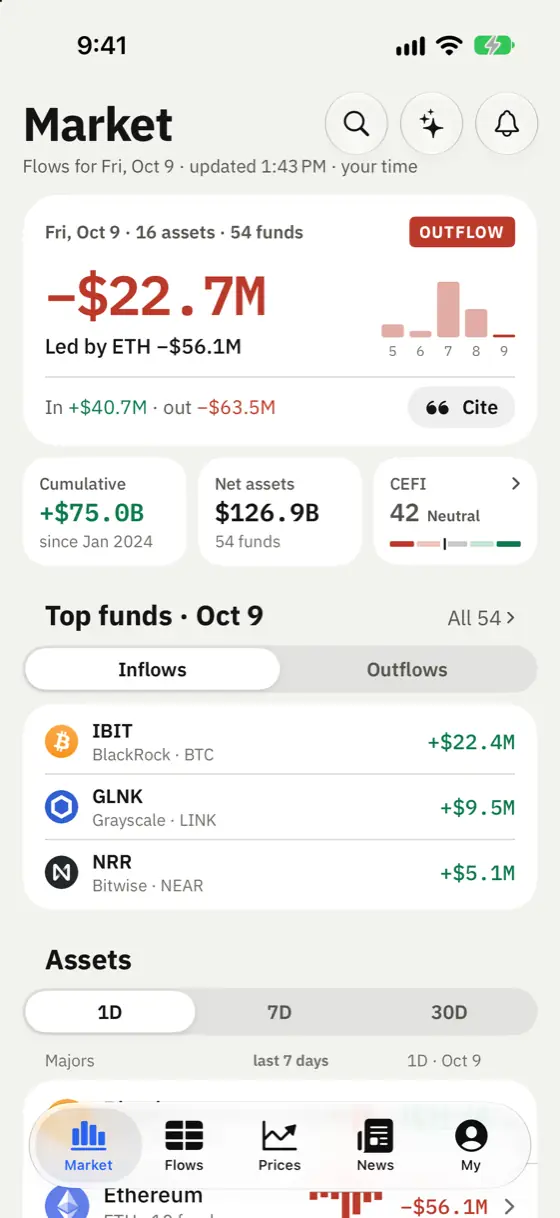
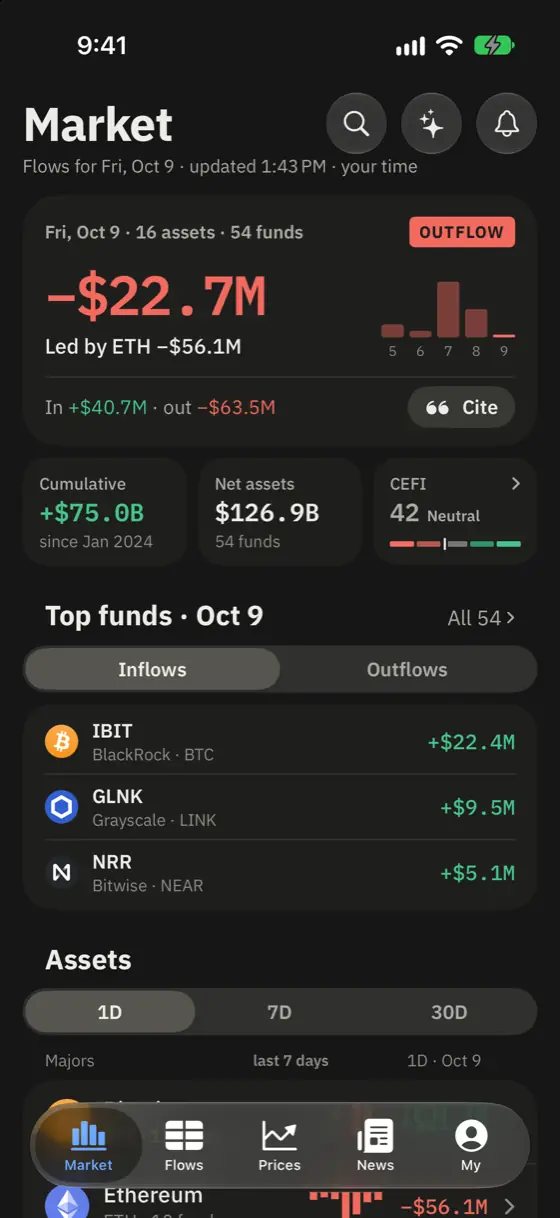
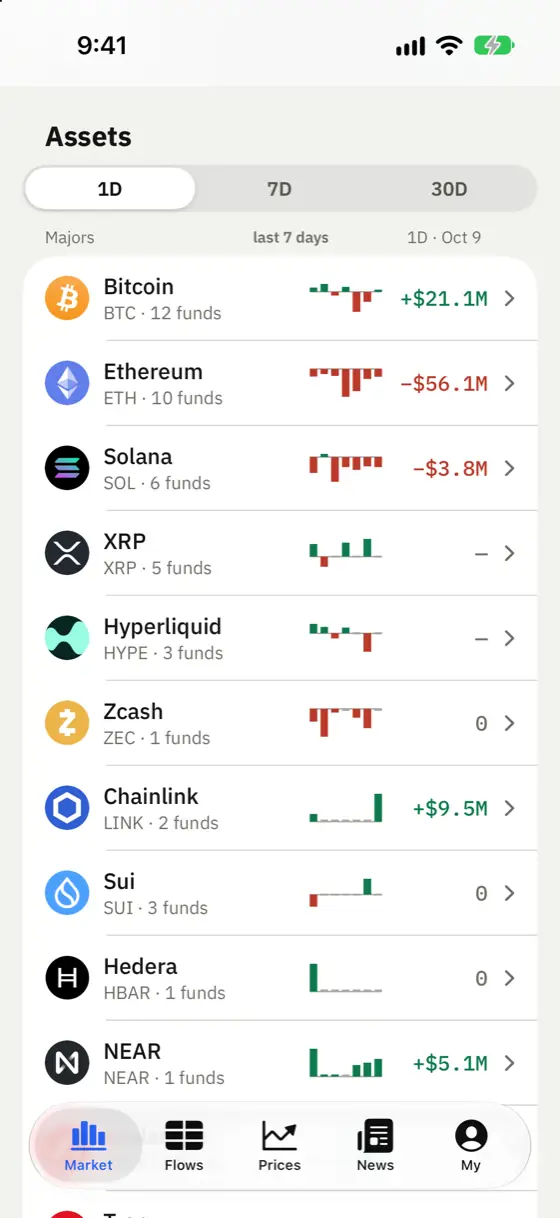
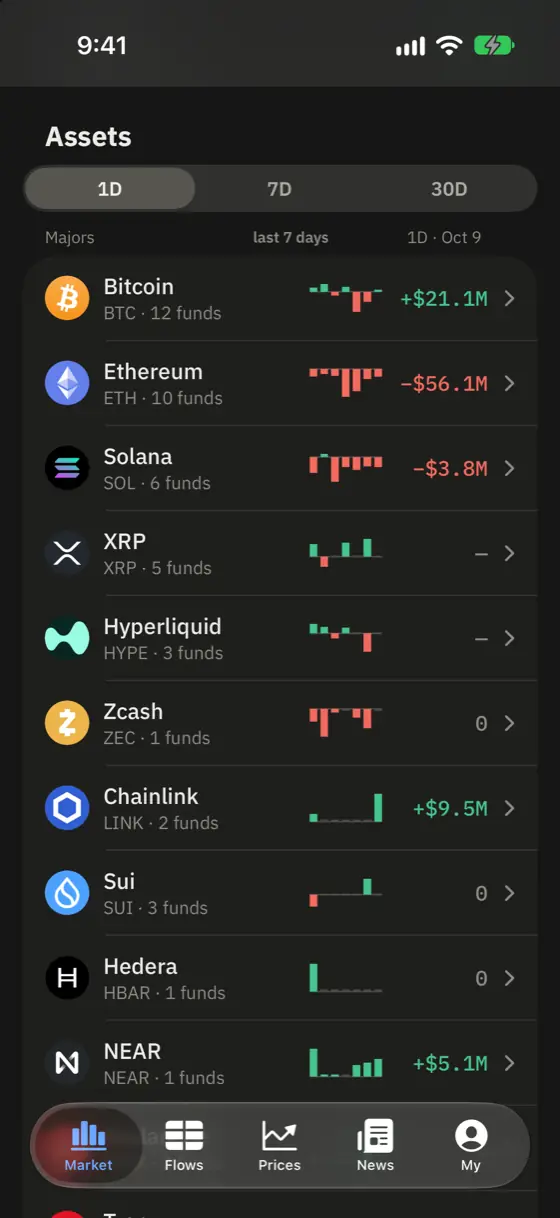
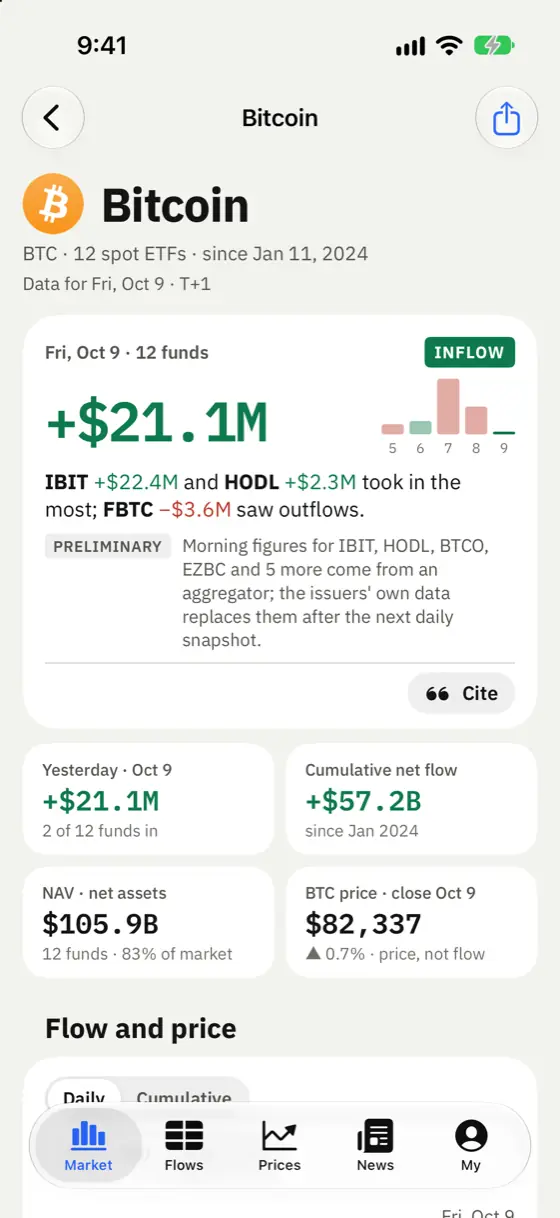
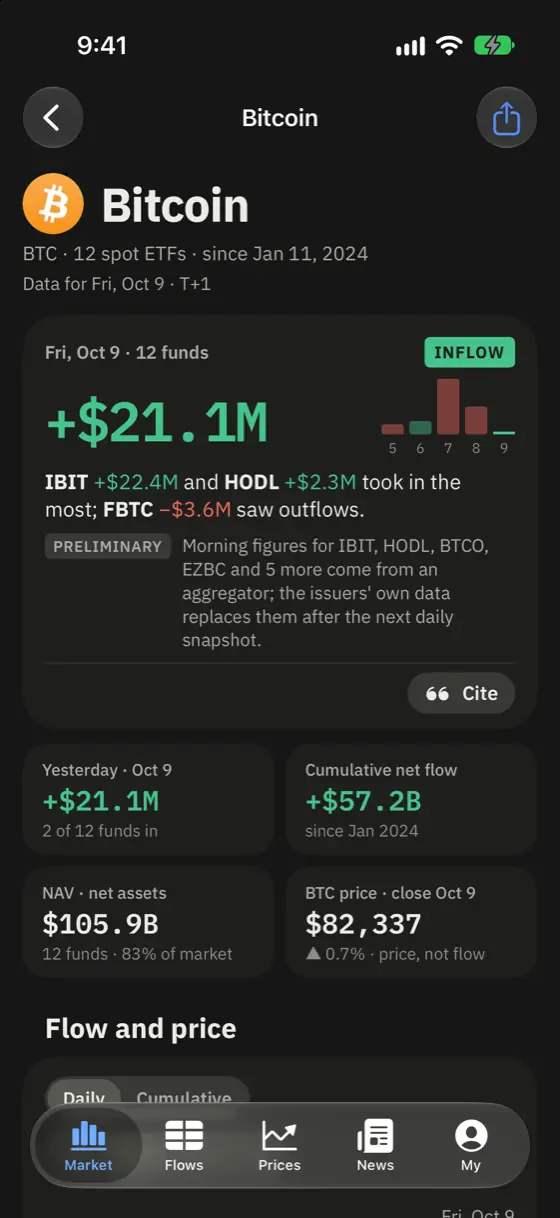
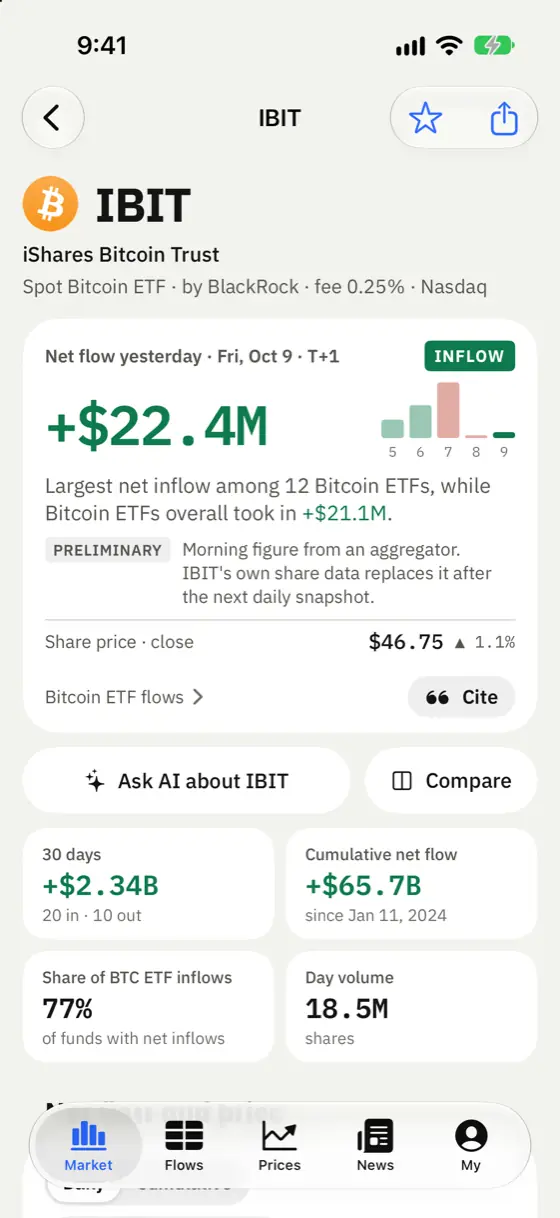
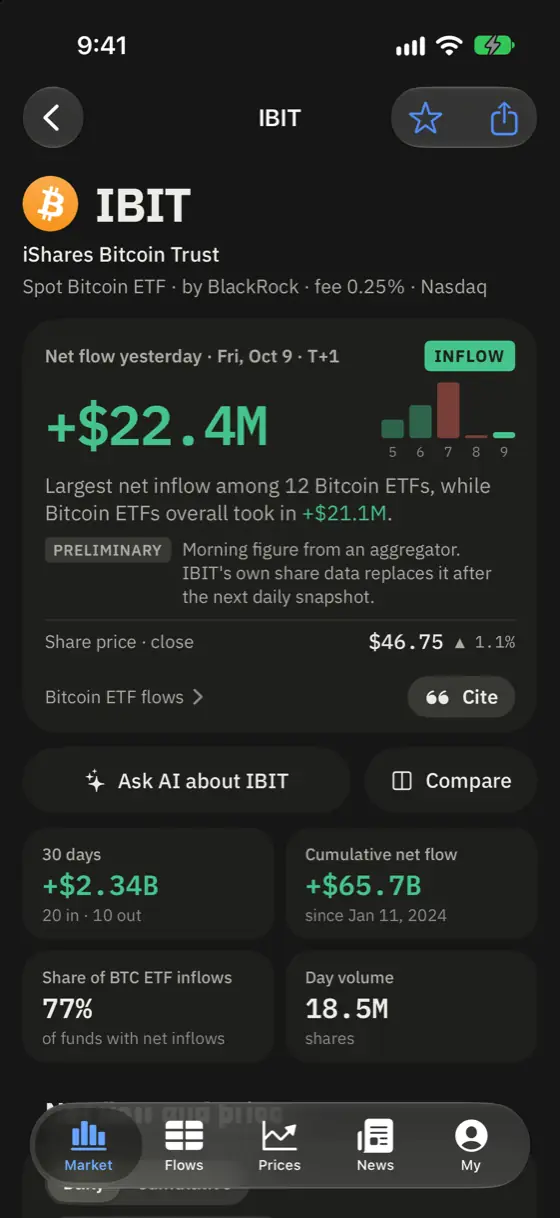
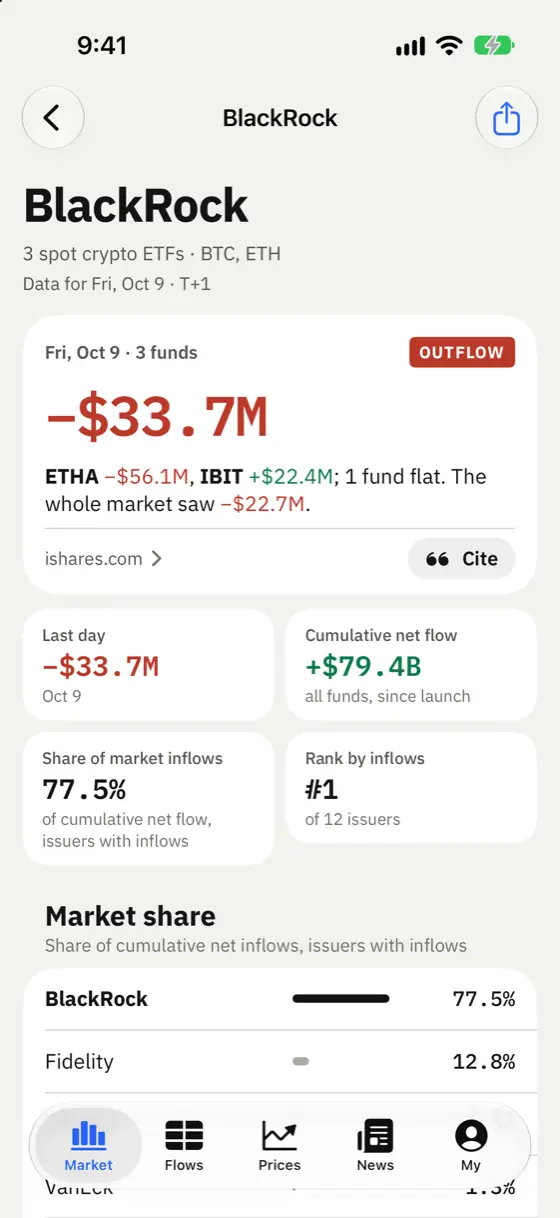
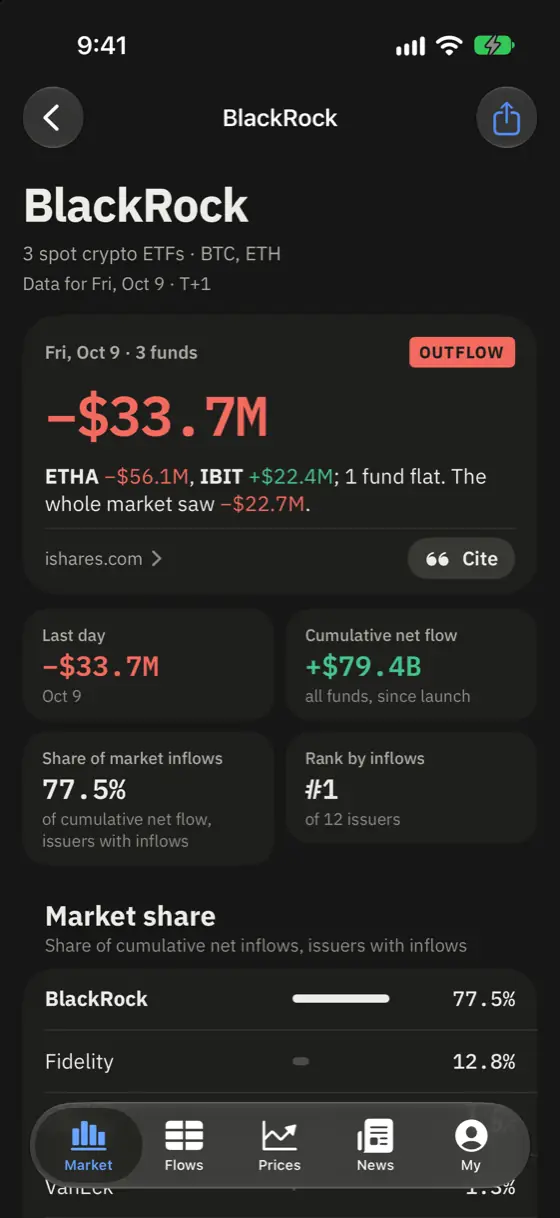
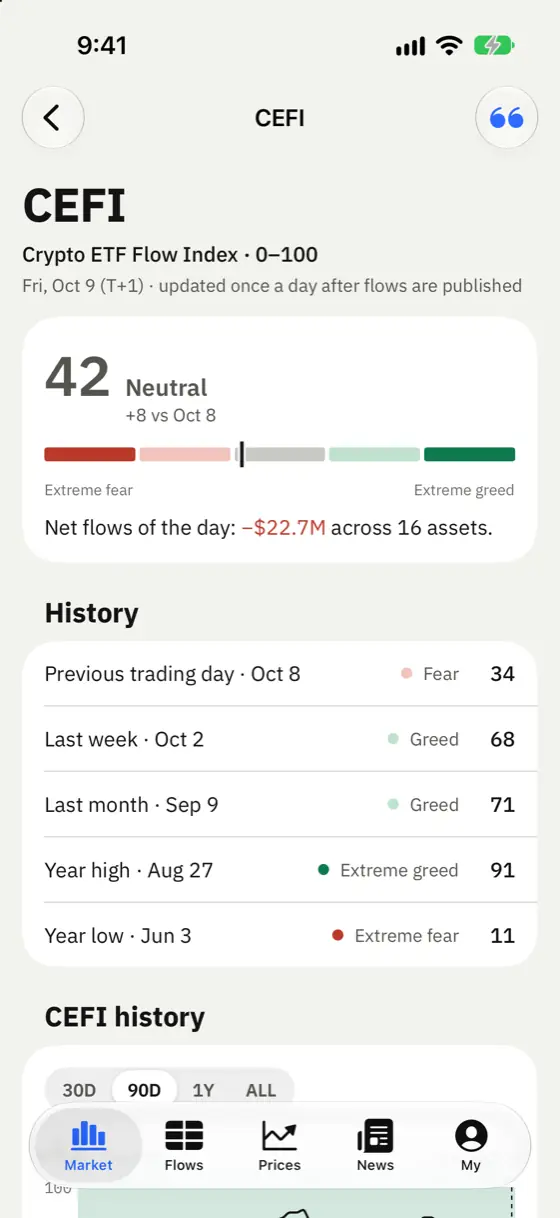
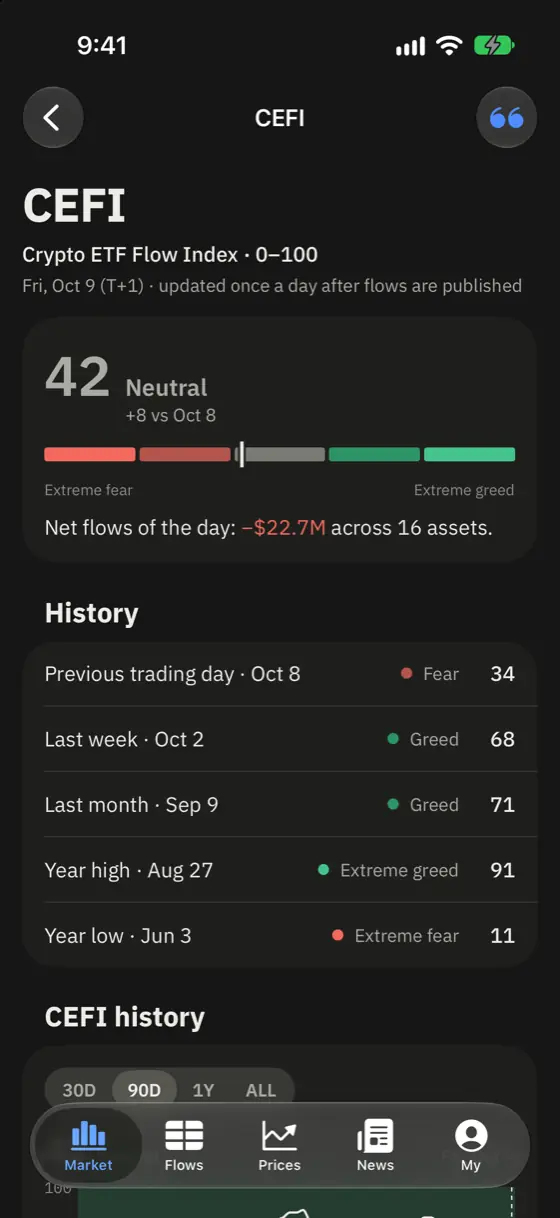
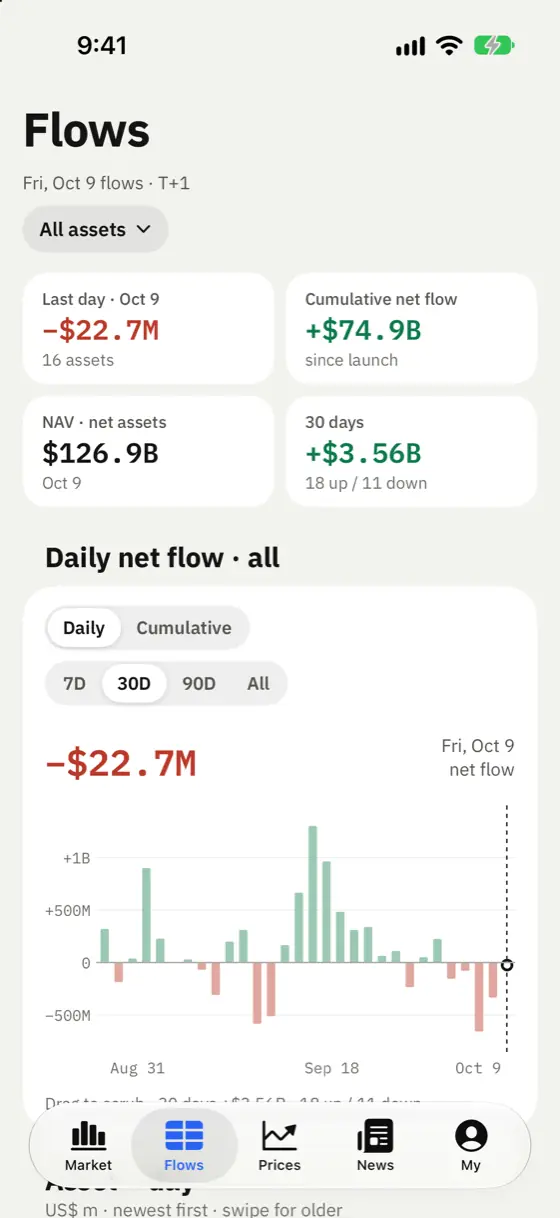
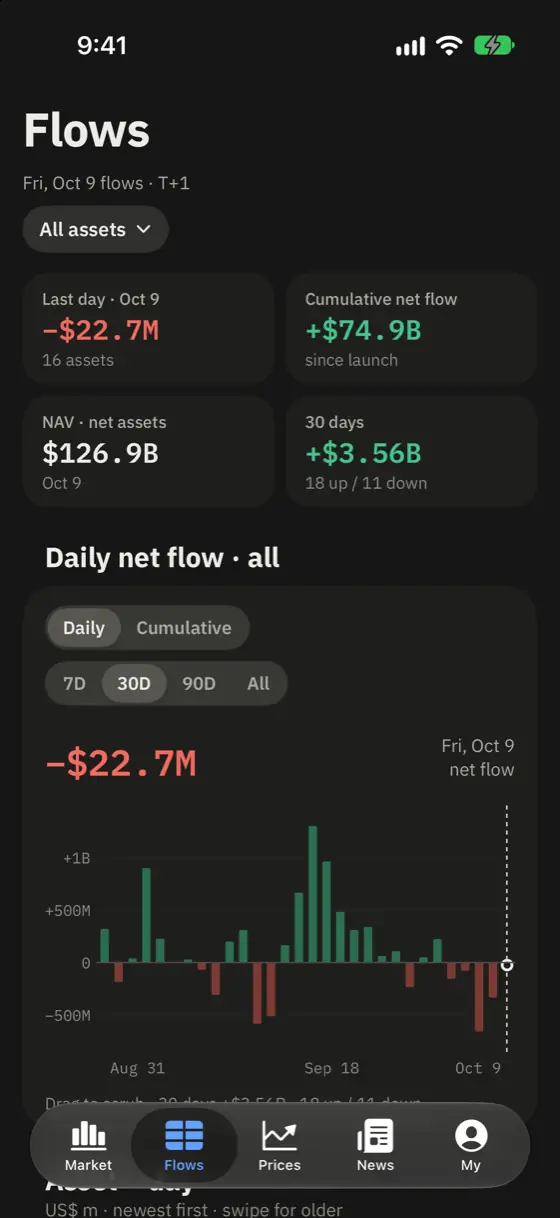
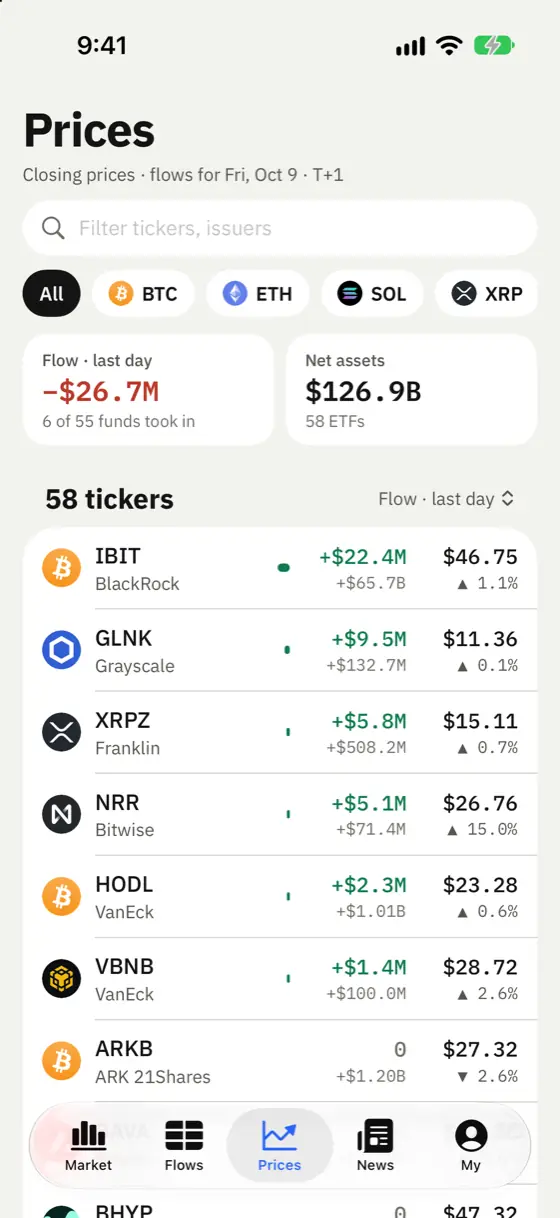
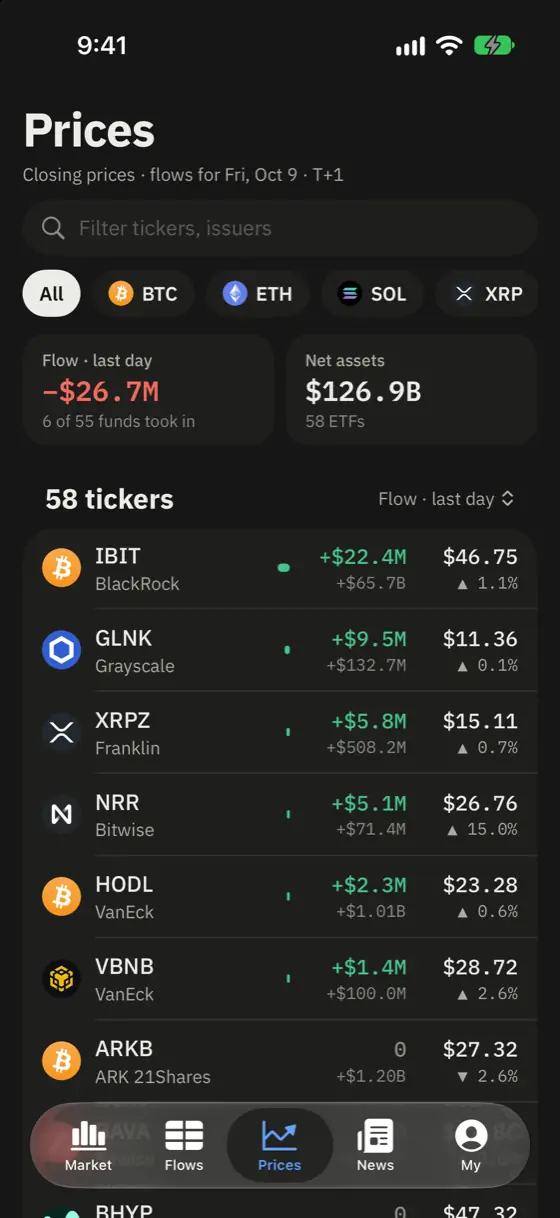
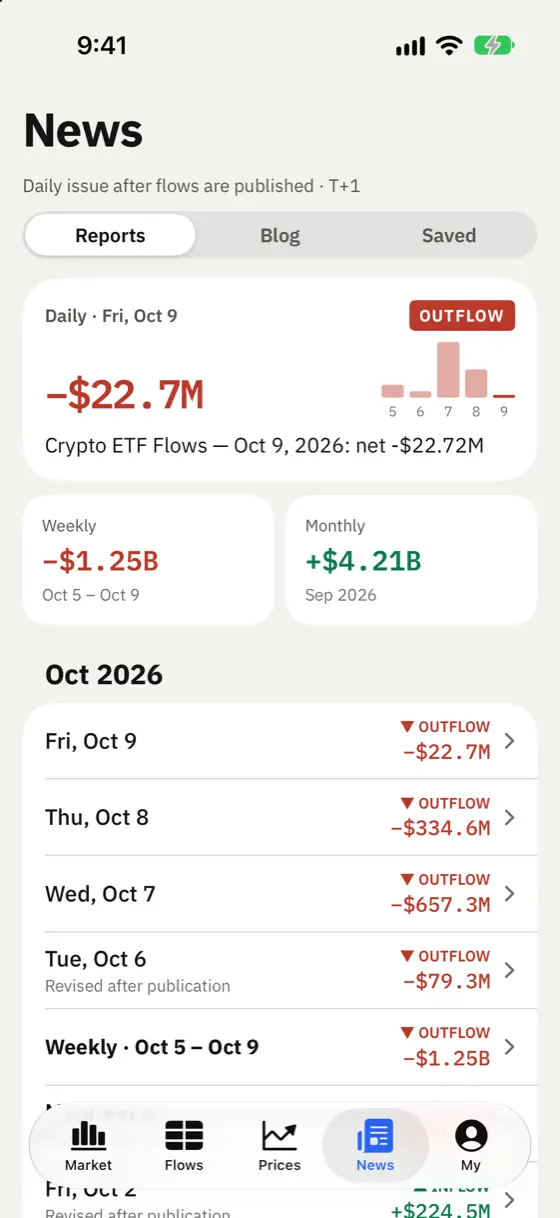
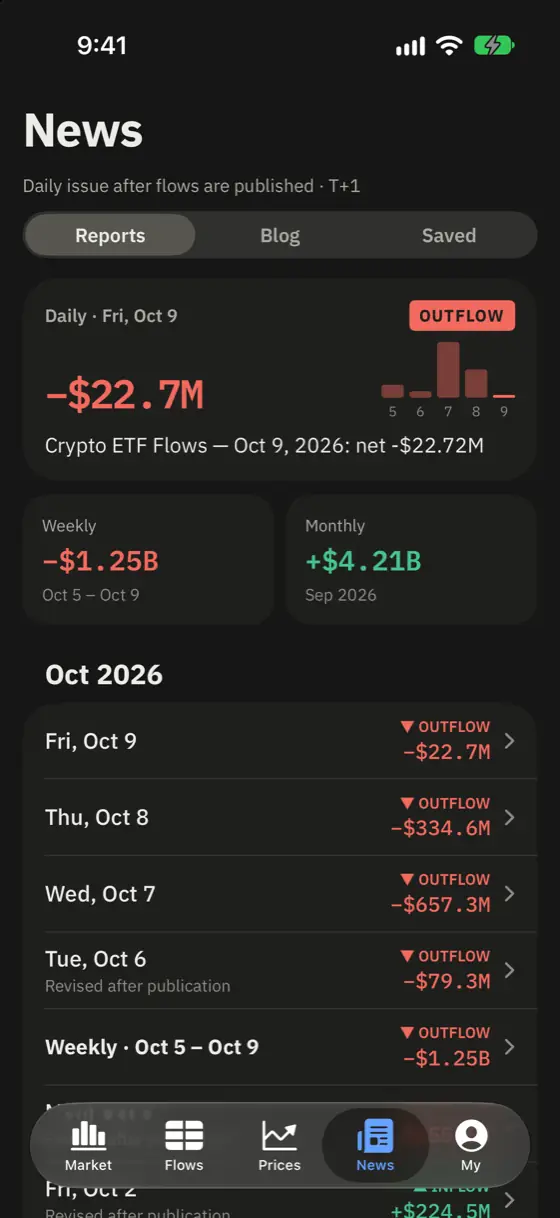
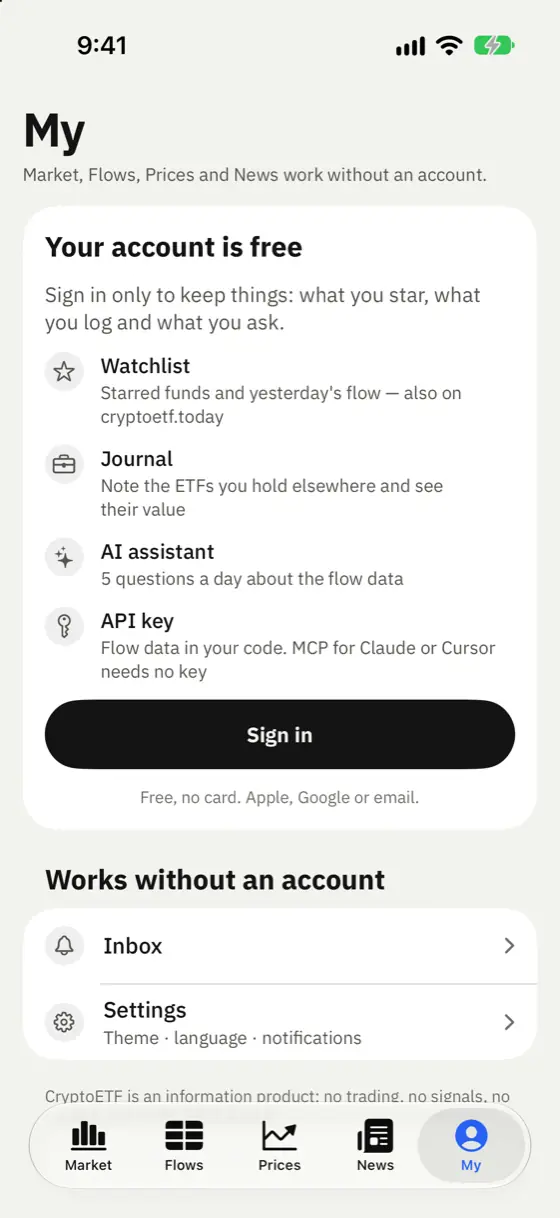
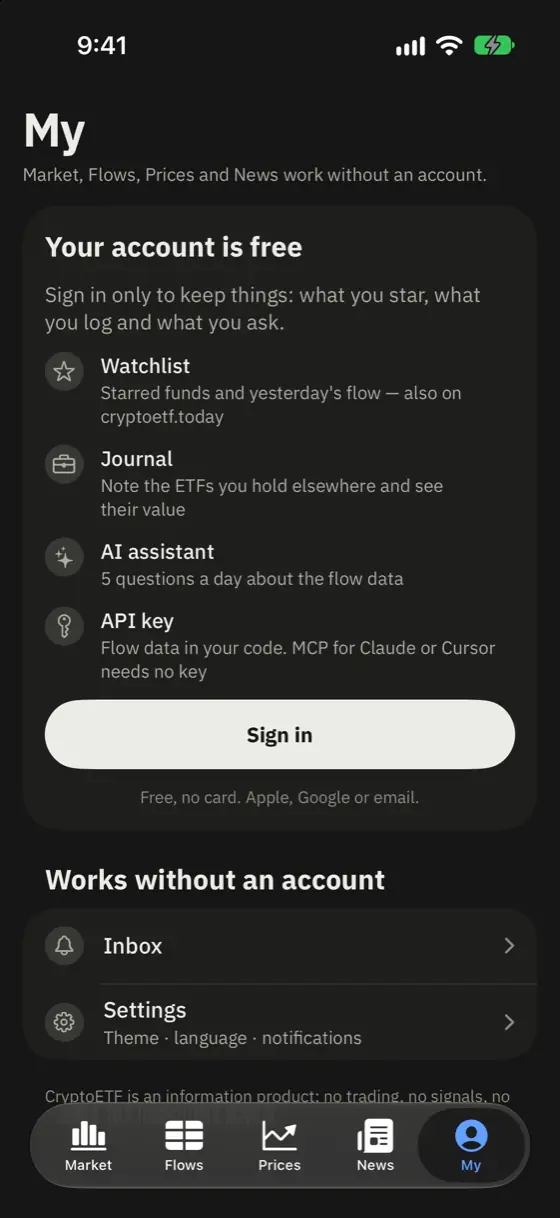
16 assets, 58 funds, 58 tickers. Fund counts as of Oct 16, 2026.
BTCBitcoin ETF flows12 funds→ETHEthereum ETF flows11 funds→SOLSolana ETF flows9 funds→XRPXRP ETF flows5 funds→HYPEHyperliquid ETF flows3 funds→ AVAXAvalanche ETF flows3 funds→
 SUISui ETF flows3 funds→
 DOGEDogecoin ETF flows3 funds→
 LINKChainlink ETF flows2 funds→
 HBARHedera ETF flows1 fund→
 LTCLitecoin ETF flows1 fund→
 DOTPolkadot ETF flows1 fund→
 BNBBNB ETF flows1 fund→
 ZECZcash ETF flows1 fund→
 TRXTron ETF flows1 fund→
 NEARNEAR ETF flows1 fund→
One product, one set of numbers, three screens.
The full app, with Home Screen and Lock Screen widgets. Pro tools are available in the iPhone app.
Free on Google Play. The new native version, with the AI assistant and every tracked asset, is on its way.
The whole product in the browser — plus a public REST API and an MCP server for AI agents.
Each trading day is published the next morning, before the US market opens, and a figure is updated if it changes later. Every screen shows when the data was last refreshed.
Analytics, not investment advice. Not affiliated with any ETF issuer. Disclaimer
Yes. The web version is free and needs no install; the Android app on Google Play is free too, and the iPhone app is coming soon to the App Store.
All US spot crypto ETFs: 58 funds and 58 exchange-listed tickers across 16 assets — BTC, ETH, SOL, XRP, HYPE, DOGE, LINK, AVAX, HBAR, LTC, BNB, DOT, SUI, NEAR, TRX and ZEC.
Every US business day. The daily digest arrives every morning, before the US open, and every screen shows the time the data was last refreshed.
No. Flows, funds, prices, CEFI and reports work without signing in. An account (Apple, Google or email) is needed only for the AI assistant and to sync a watchlist or portfolio with cryptoetf.today.
No — never. It is a read-only analytics tool: no wallet, no exchange connection, no trading and no custody. Portfolio positions are entered by hand.
On iPhone, yes: small, medium and large Home Screen widgets and a Lock Screen widget. You choose which assets appear and in which order.
It is coming soon to the App Store, with everything on this page plus Home Screen and Lock Screen widgets. Until then, the web version in Safari shows the same data.
The Crypto ETF Flow Index is a 0–100 sentiment score built from spot-ETF flows across all 16 assets. Higher means stronger net inflows (risk-on), lower means net outflows (risk-off). It is updated daily.
The app is translated into 44 languages; the website into 18.
No. cryptoetf.today publishes market data and analytics. It is not investment advice and is not affiliated with any ETF issuer.
Be reading them, not looking for them.