
Two LINK ETFs, two disclosures: a Grayscale spreadsheet and a Bitwise page with a wallet. 93 of 200 sessions moved for $156.2m, two were redemptions, and the fee is the only leak.
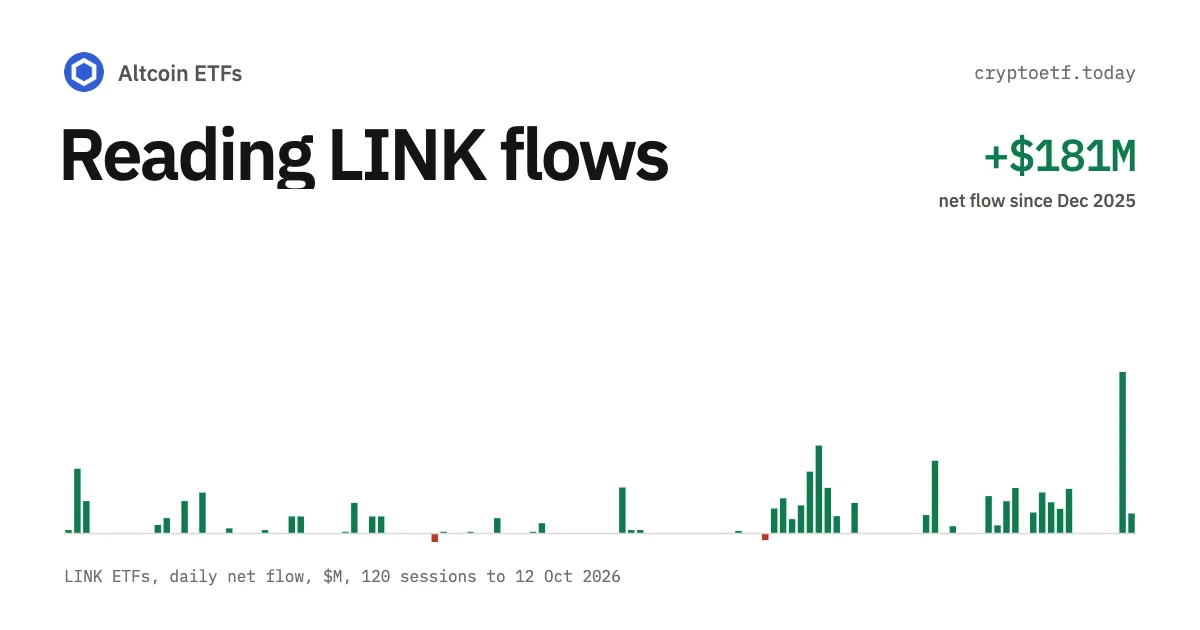
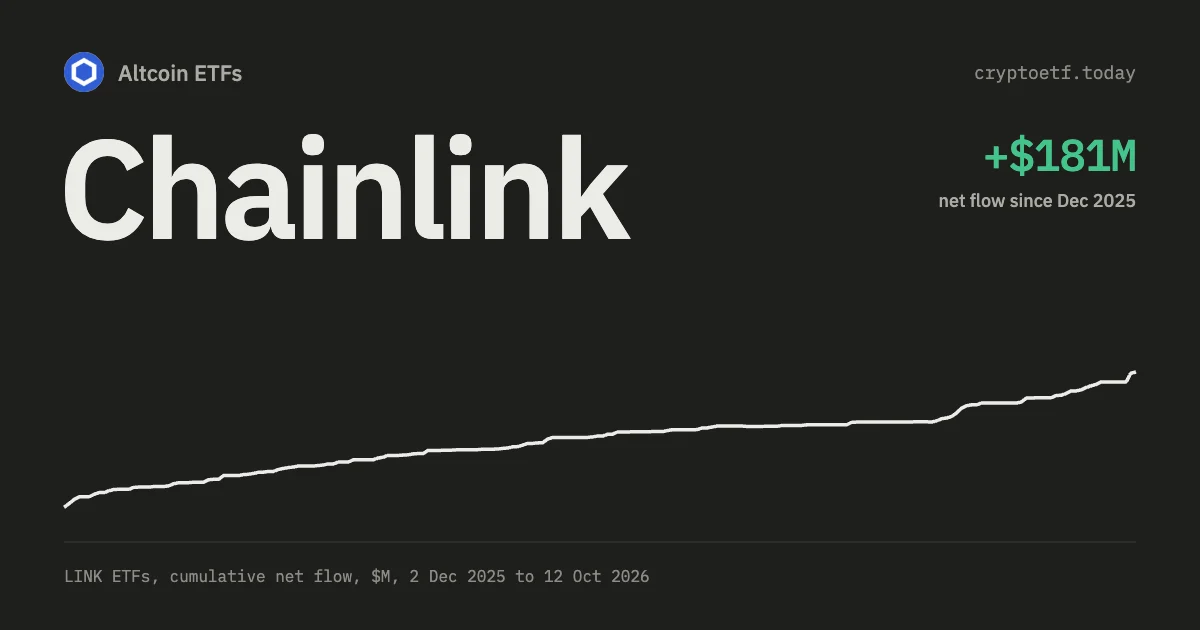
TL;DR. A Chainlink ETF flow is the dollar value of shares an authorised participant created or redeemed that day. No aggregator publishes it, so the site computes it from two issuer disclosures: Grayscale's daily spreadsheet for GLNK and the Bitwise fund page, with its wallet, for CLNK. Read on 19 September 2026, the series ran 200 sessions from 2 December 2025 and 93 were non-zero: 91 creations, 2 redemptions, $156.2m of cumulative net inflow, the highest hit rate of the eight issuer-computed assets by a wide margin. Neither fund stakes, so only the fee moves LINK per share: GLNK went from 0.88776770 LINK on listing day to 0.88606859 on 18 September, a 0.19% decline that dates the end of its fee waiver to the day.

Chainlink ETF flows, live
as of Thu 19 Nov · updated every trading dayContents · 11 sections
- What the number measures
- Two funds, two disclosures, one formula
- GLNK from the spreadsheet: the listing week
- CLNK: the page, the wallet and the missing months
- What the series looks like
- Why LINK's flows kept coming when the other seven stopped
- No staking, so the coin count only leaks through the fee
- How LINK enters the CEFI composite
- Five ways to misread this data
- FAQ
- Sources and further reading
What the number measures
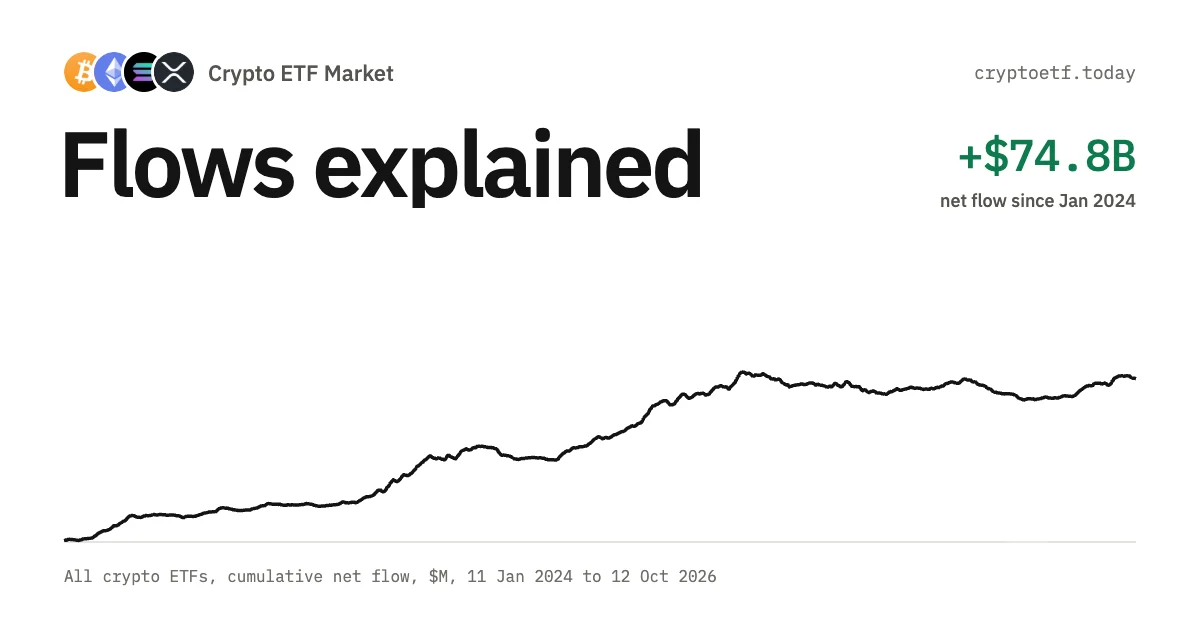
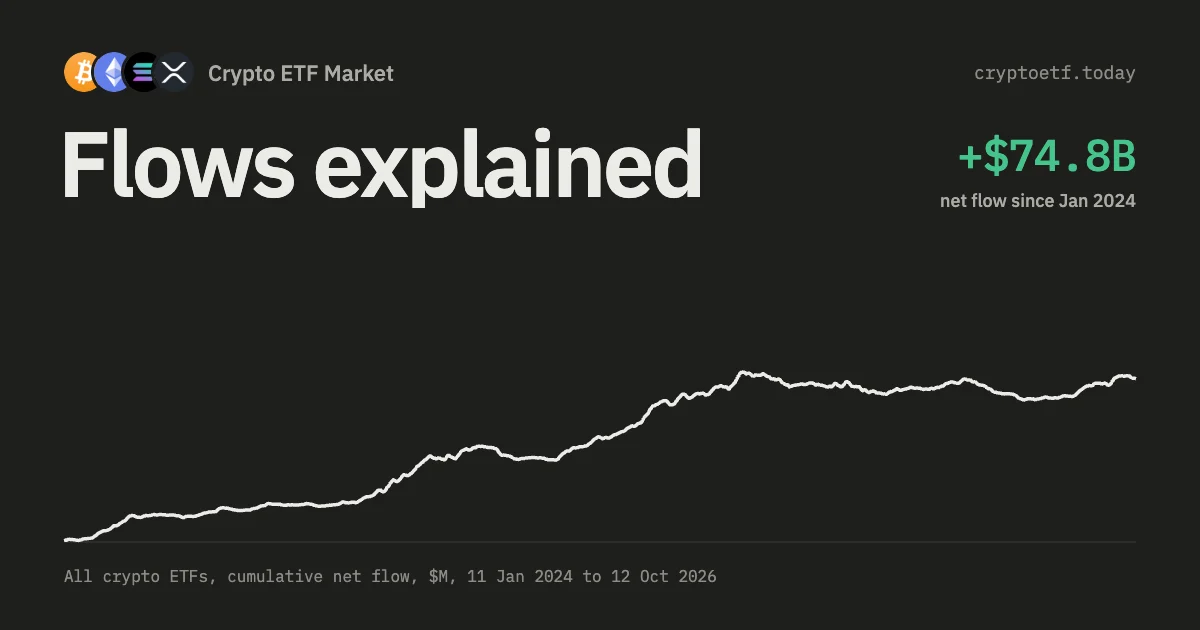
A +$2.4m print on the Chainlink ETF flows page means an authorised participant delivered LINK or cash to a trust and took new shares, so the trust holds more LINK than it did yesterday. A redemption is the reverse. Shares changing hands on NYSE Arca produce nothing, because the trust isn't involved. The mechanic is the one in crypto ETF flows explained; fund facts (fees, custody, the staking ban, the European ETPs) are in Chainlink ETF explained. This piece is about the data.
Two funds, two disclosures, one formula
The site's formula for a fund that publishes a share count is:
flow(T) = (shares(T+1) − shares(T)) × NAV(T)
The day shift exists because an order placed on Tuesday appears in Wednesday's share count at Grayscale. Checked against independent data for the window when GLNK was the only LINK fund (2 December 2025 to 13 January 2026, 29 sessions), the method matched every day to the dollar except the first, and that one was a valuation convention, covered below.
| Fund | What the issuer publishes | How the site gets a flow | When a Tuesday order shows up |
|---|---|---|---|
| GLNK (Grayscale) | Daily XLSX: shares outstanding, NAV, market price and AUM for every trading day since 20 September 2021; a Holdings sheet with LINK per share | Standard formula on the file; rows before the 2 December 2025 listing are dropped | Wednesday evening, dated Tuesday |
| CLNK (Bitwise) | Fund page whose server-rendered JSON carries today's shares, net assets, LINK held, a NAV chart since 13 January 2026 and one Ethereum address; no share history | Daily snapshots of the share count since 27 July 2026, paired under the same-day rule | Tuesday evening, dated Tuesday |
The Bitwise dating rule
Bitwise's share count dated T already includes T's orders (21Shares and Canary publish the same way). For those issuers the site pairs today's snapshot with yesterday's, prices the difference at NAV(T) and dates it T. The rule was added after a check on 13 September 2026 showed the standard formula placing Bitwise's flows a day early. On 10 September 2026 Grayscale's file shows 12,972,010 shares, then 13,202,010 on the 11th, so GLNK printed 230,000 shares at the 10th's $10.29 NAV, $2.37m. The same day CLNK's count rose by 90,000 shares at its $21.16 NAV, $1.90m. Both are dated 10 September, $4.27m together, the fourth-largest day of the series. Without the rule the CLNK leg would sit on the 11th and look like an echo.
GLNK from the spreadsheet: the listing week
The file's first ETF rows are the clearest worked example the series offers, because converting a private trust into a listed fund produced a creation on day one.
| Row date | Shares outstanding | NAV | Flow dated | Computation | Flow |
|---|---|---|---|---|---|
| 1 Dec 2025 | 1,472,010 | $10.59 | OTC trust, no market price yet | ||
| 2 Dec 2025 | 1,472,010 | $11.85 | 2 Dec | (4,972,010 − 1,472,010) × $10.59 | +$37.07m |
| 3 Dec 2025 | 4,972,010 | $12.81 | 3 Dec | (5,272,010 − 4,972,010) × $12.81 | +$3.84m |
| 4 Dec 2025 | 5,272,010 | $12.75 | 4 Dec | (5,622,010 − 5,272,010) × $12.75 | +$4.46m |
| 5 Dec 2025 | 5,622,010 | $12.05 | 5 Dec | 240,000 × $12.05 | +$2.89m |
Source: Grayscale's daily performance file for GLNK, read 19 September 2026. The 3.5 million shares created on listing day are priced at the previous day's $10.59 NAV rather than the $11.85 struck on 2 December, a convention that keeps the cumulative line comparable with the rest of the market; at the day's own NAV the print would be $41.5m. That choice is worth $4.4m and happens once. Nothing before 2 December counts: the 1,472,010 shares the trust carried into listing are opening assets, not flows.
From there the file is mechanical. Between listing and 18 September the share count changed on 63 rows, every change a multiple of the 10,000-share basket the 10-K describes, the smallest 20,000 shares and the largest after listing 500,000 (dated 21 August 2026 at $10.33, the $5.2m that is the biggest post-listing day). Sixty were creations; the three redemptions, on 22 June, 8 July and 13 August, were 150,000 shares and $1.1m between them. The page's GLNK column matches the recomputed file on all 63 days.
CLNK: the page, the wallet and the missing months
Bitwise discloses differently. The CLNK page on 18 September 2026 reported 2,200,000 shares, $49.24m of net assets and 4,000,665.27 LINK in the trust; the one Ethereum address it lists, 0xA2448CE8324Ff68d6c22928FE233B951F2DeEC6f, held 4,000,665.27 LINK when the wallet feed refreshed on 19 September. CLNK's LINK sits unstaked in one ERC-20 balance, so the page and the chain agree to the coin, and anyone can check.
What the page doesn't carry is a history of the share count. So the CLNK column on the site begins on 27 July 2026, when daily snapshots started, and it is empty (not zero) before that. The money isn't missing from the asset total: between CLNK's 14 January listing and 24 July the total exceeds GLNK's column by $26.0m across 62 days, CLNK's early history carried over from the aggregate series during the backfill. Bitwise's 10-Q for the quarter to 30 June 2026 reconciles it: $27.3m of capital share transactions from inception, of which $2.5m was the 100,000-share seed basket an affiliate bought at $25.00 on 13 January and sold the next day. Take out the seed and the two figures agree.
Since 27 July every CLNK print has been a whole number of baskets at that day's NAV, from 10,000 shares (10 and 27 August) to 120,000 (17 August): 600,000 shares and $11.3m on ten days, with no redemptions. Working backwards from 2,200,000, the first snapshot must have shown 1,600,000 shares, 80,000 above the 1,520,000 in the 30 June 10-Q; those eight July baskets are in the asset total but not in CLNK's column.
What the series looks like
| As of 18 Sep 2026 | GLNK | CLNK | Asset total |
|---|---|---|---|
| Per-fund series from | 2 Dec 2025 | 27 Jul 2026 | 2 Dec 2025 |
| Trading sessions with data | 200 | 39 | 200 |
| Sessions the flow was non-zero | 64 | 10 | 93 |
| Creations / redemptions | 61 / 3 | 10 / 0 | 91 / 2 |
| Cumulative net flow in the column | +$118.9m | +$11.3m | +$156.2m |
| Shares, first row → now | 1,472,010 → 13,202,010 | 1,600,000 → 2,200,000 | |
| Assets | $144.8m | $49.2m | $194.0m |
| LINK held | 11.70m | 4.00m | 15.70m |
| Largest single day | +$37.1m (2 Dec, listing); +$5.2m (21 Aug) | +$2.07m (17 Aug) | +$37.1m; +$5.2m after listing |
Source: the site's LINK series read on 19 September 2026, Grayscale's daily file and the Bitwise fund page. The two redemption days in the asset total are 22 June (−$0.5m) and 13 August (−$0.4m); the 8 July GLNK redemption is netted against a CLNK creation and the day shows +$0.1m. GLNK's column has one more creation day than the file because the page's 18 September figure (+$2.19m, 200,000 shares at $10.97) is a provisional morning fill and can't be confirmed until Grayscale posts the Monday row.
By month: $59.2m in December's 21 sessions, then $15.3m, $13.2m, $10.8m, $13.2m and $8.2m from January to May, a trough of $3.6m in June and $4.7m in July, $20.1m in August and $8.0m in the first 13 sessions of September. The longest run of zeros was 10 sessions, 27 July to 7 August. Weekends and US holidays are a different kind of empty: no NAV is struck, there is no row to compute, and the page leaves those days blank rather than printing zero. LINK trades on Sunday; the ETFs don't.
Why LINK's flows kept coming when the other seven stopped
Chainlink didn't have the biggest opening among the eight assets the site computes itself. Canary's Hedera fund took $66.5m in its first five sessions from 28 October 2025, against $48.3m for GLNK's first four, and Hedera was still ahead at the 30-session mark. What sets LINK apart is what happened next.
| Asset (listed) | Sessions | Non-zero | First 30 sessions | After session 30 | Last 60 sessions | Longest zero run | Cumulative |
|---|---|---|---|---|---|---|---|
| LINK (2 Dec 2025) | 200 | 93 (46%) | +$66.4m | +$89.8m on 76 days | +$32.8m on 22 days | 10 | +$156.2m |
| HBAR (28 Oct 2025) | 223 | 53 (24%) | +$82.9m | +$26.2m on 36 days | +$6.9m on 11 days | 13 | +$109.1m |
| AVAX (26 Jan 2026) | 164 | 24 (15%) | +$8.9m | +$24.0m on 19 days | +$2.1m on 11 days | 43 | +$32.9m |
| SUI (18 Feb 2026) | 148 | 28 (19%) | +$10.4m | +$2.2m on 22 days | +$7.5m on 12 days | 13 | +$12.6m |
| DOGE (24 Nov 2025) | 205 | 34 (17%) | +$6.3m | +$6.2m on 25 days | −$0.3m on 9 days | 18 | +$12.5m |
| LTC (28 Oct 2025) | 224 | 27 (12%) | +$7.6m | +$3.1m on 18 days | +$0.6m on 8 days | 27 | +$10.7m |
| DOT (6 Mar 2026) | 135 | 6 (4%) | +$1.6m | +$1.1m on 2 days | +$0.7m on 1 day | 64 | +$2.7m |
| BNB (28 May 2026) | 79 | 4 (5%) | +$1.4m | −$0.3m on 2 days | −$0.3m on 2 days | 48 | +$1.1m |
Source: the site's eight asset series, read 19 September 2026; listing-day creations included. After session 30, Chainlink took in $89.8m and the other seven complexes $62.5m combined; in the most recent 60 sessions it was non-zero on 22 days, and no other asset managed more than 12. Two structural facts sit behind that. GLNK wasn't a new product: the trust had been sold privately since 2021, quoted OTC since 2022, and carried $17.5m of assets into listing day, so the holder base and the creation process were already running. And LINK has two issuers, the second of which waived its whole fee on the first $500m for three months from 14 January 2026. Whether that explains 76 creation days after the opening month the flow data can't settle. What it can say is that the buying didn't depend on the price: LINK fell from $14.64 on 3 December to $7.20 on 30 June, and the 81 sessions when it traded below $9 took in $21.7m on 28 creation days. Prices in the flow rows are the daily close of the USDT pair, not the funds' benchmark rates.
No staking, so the coin count only leaks through the fee
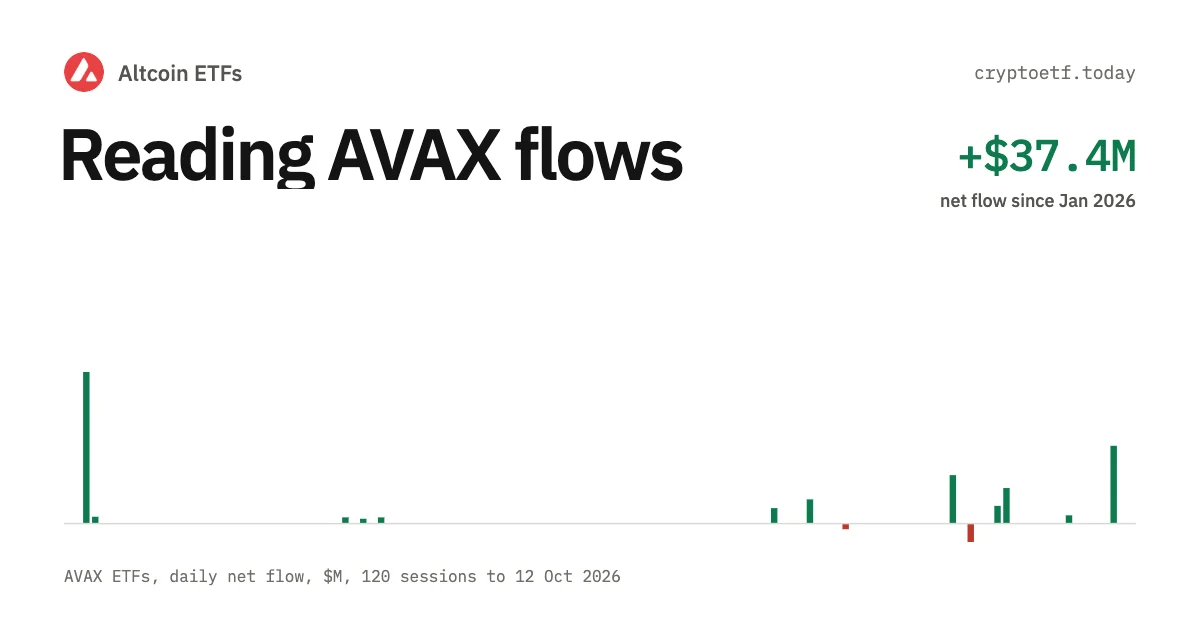
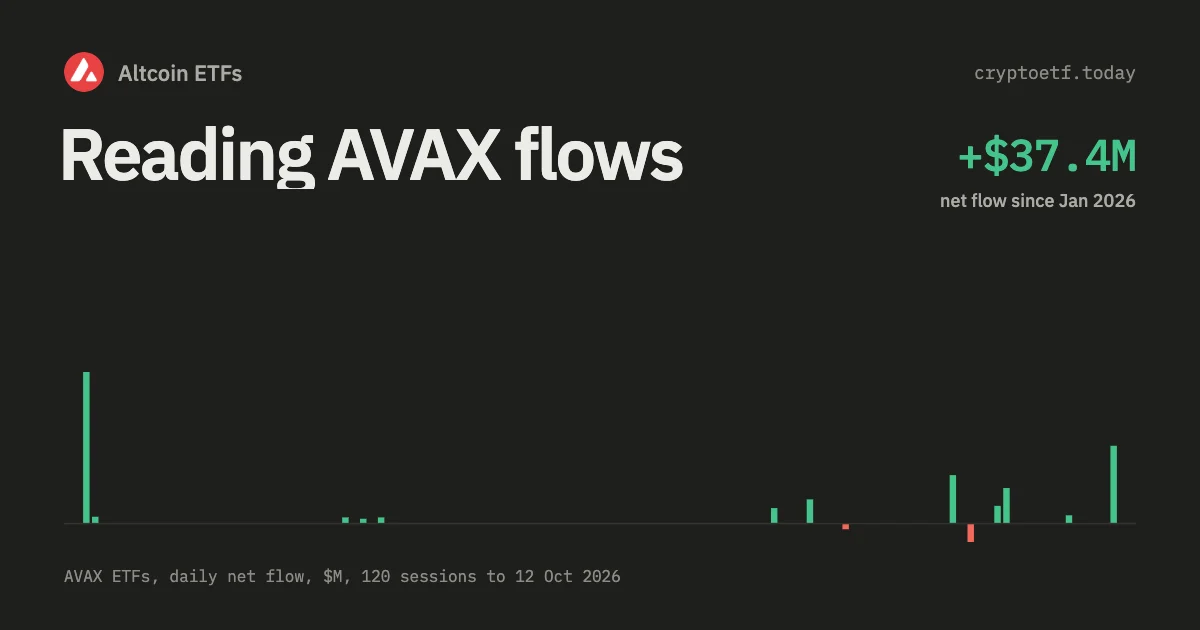
Neither fund stakes. Grayscale's trust documents prohibit it; Bitwise's 10-Q says the trust does not stake but intends to at some future date. For reading the data that is a simplification. On a staking fund such as Bitwise's Avalanche ETF, rewards raise the coin count and the series has to convert coins to shares before anything is a flow (the method is in how to read Avalanche ETF flows). On a LINK fund, coins per share can only fall, and only by the fee, which both trusts pay in LINK. A fee payment never prints as an outflow.
Grayscale's file makes the check easy because its Holdings sheet states LINK per share. On listing day a GLNK share was backed by 0.88776770 LINK; on 18 September 2026 it was 0.88606859, a decline of 0.1914%. The 10-K says the 0.35% fee was waived from 2 December 2025 until 2 March 2026 (or $1bn of NAV, which never came) and that no fee was incurred in December. Two hundred days separate 2 March and 18 September, and 0.35% × 200 ÷ 365 = 0.1918%. Had the fee run from listing day, 290 days would have taken 0.278%. The ratio itself tells you when the waiver ended, to within a day. The year before is the contrast: as a private trust GLNK charged 2.5%, and its LINK per share fell from 0.9084 to 0.8878 during 2025, twelve times the ETF-era rate.
For CLNK the check needs two documents. The 30 June 10-Q shows 2,766,406.12 LINK against 1,520,000 shares, 1.82000 LINK per share; the fund page on 18 September shows 4,000,665.27 against 2,200,000, or 1.81848. That is 0.083% in 80 days. Bitwise's fee accrues daily at 0.34% but is paid in LINK monthly in arrears, so the window holds the June, July and August payments, about 92 days of fee, or 0.086%. The 10-Q puts the waiver in dollars: $24,135 of fee accrued from 13 January to 30 June, $8,885 waived (14 January to 13 April, on the first $500m), and 1,051.07 LINK transferred to the sponsor to pay the rest. The ratio is the one place a waiver's expiry is visible; NAV, assets and flows carry on as before.
In coins: a thousand GLNK shares held from listing day represented 887.77 LINK and represent 886.07 today, 1.70 fewer, and will lose about 3.1 LINK a year from here. A self-custodied holder with a place in Chainlink's community staking pool earns rather than pays; the rate and the pool cap are in the explainer.
How LINK enters the CEFI composite
Chainlink has no per-asset score on the CEFI page; only Bitcoin, Ethereum, Solana, XRP and Hyperliquid do. LINK enters the composite as a single daily total, without the per-fund weighting step the five original assets get. The total is divided by LINK's market capitalisation (daily close times a fixed 680,000,000 supply constant), smoothed with an exponential moving average where today counts 30% and yesterday's smoothed value 70%, then added to the same quantity for the other twelve assets before the composite is z-scored against a window of at most 90 rows and mapped to 0–100. The constants are in how the CEFI index is calculated.
Scaling by market cap is what lets a $5m day register. GLNK's $5.2m on 21 August 2026 was 0.063% of a LINK market cap of about $8.2bn at that day's $11.99 close; a Bitcoin day of the same proportion would be roughly $1.2bn at the $95,000 price the CEFI explainer uses in its example. LINK's contribution is also steadier than the other small complexes' because its series is 46% non-zero rather than 85% zeros: a lone basket in Avalanche or Polkadot is a spike that fades in two weeks; 22 creation days in 60 sessions is what the smoothing was built for.
Five ways to misread this data
- Reading CLNK's empty months as no flows. The column is null before 27 July 2026 because there is no share history to compute from. The $26.0m CLNK raised between January and July is in the asset total, and the 10-Q confirms it.
- Comparing cumulative flow with assets. The funds hold $194.0m and the series has raised $156.2m. The gap is GLNK's $17.5m of pre-listing assets, CLNK's $2.5m seed basket and the price of LINK since each basket was bought.
- Waiting for redemptions to confirm a top. Two redemption days in 200 sessions, $0.9m together, through a drawdown from $14.64 to $7.20. An outflow needs the share price to sag below NAV far enough for an AP to bother; its absence is a property of small funds with few traders, not evidence of conviction.
- Reading the fee as selling. GLNK's 13.2m shares shed about 41,000 LINK a year at 0.35%, CLNK's 2.2m about 13,600 at 0.34%, and none of it appears in the flow rows. Compare coins per share, not coins.
- Treating the newest row as final. GLNK's figure for day T needs the T+1 row of Grayscale's file. Until it arrives the day carries a provisional morning fill, which is why the page's 18 September GLNK print existed on the 19th while the file still showed 13,202,010 shares.
The routine follows from the shape of the series. Read the cumulative line first; on a series that is half creations and almost no redemptions, its slope is the signal, and a flattening (June and July 2026, $8.3m in two months) says more than any bar. Count baskets rather than dollars: 10 September's $4.27m was 32 baskets across two funds, three fewer than 4 December's $4.46m. And note which column moved. Through 18 September GLNK had taken 61 creations and CLNK 10 since late July; a shift in that ratio is the earliest sign the second fund is finding its own buyers, the question the explainer left open.
The Chainlink ETF flows page shows the daily net figure, the cumulative line and a per-fund table, updated every business day after both issuers post. It isn't real-time, and the CLNK column starts on the day the site could first compute it, six months after the fund listed.
FAQ
What does a Chainlink ETF inflow mean?
New shares were created that day: an authorised participant delivered LINK or cash to GLNK or CLNK and the trust’s holdings grew. The figure is the change in shares outstanding multiplied by NAV, in 10,000-share baskets. It is not trading volume on NYSE Arca, and the sponsor fee, paid in LINK, never appears as an outflow.
Where does the GLNK flow data come from?
From Grayscale’s daily performance spreadsheet, which lists shares outstanding, NAV, market price and AUM for every trading day since September 2021 plus a Holdings sheet with LINK per share. The site applies flow(T) = (shares(T+1) − shares(T)) × NAV(T) from the 2 December 2025 listing onward; the recomputed file matches the page’s GLNK column on all 63 days the share count changed.
Why is the CLNK column empty before 27 July 2026?
Bitwise’s fund page publishes today’s share count but no history, so per-fund flows for CLNK can only be computed from the daily snapshots the site began taking on 27 July 2026. CLNK’s earlier inflows, about $26.0m between its 14 January listing and 24 July, are in the asset total, and Bitwise’s 30 June 10-Q reconciles to that figure once the $2.5m seed basket is excluded.
Why do Chainlink ETF flows show so few outflows?
Through 18 September 2026 the asset series had two redemption days out of 200 sessions, on 22 June and 13 August, worth $0.9m together, even though LINK fell from $14.64 to $7.20 over the period. A redemption only happens when the share price drops far enough below NAV for an authorised participant to act; a holder who sells to another investor leaves no trace in the data.
How does the sponsor fee show up in the data?
Only in coins per share. GLNK went from 0.88776770 LINK per share on 2 December 2025 to 0.88606859 on 18 September 2026, a 0.19% decline that equals 0.35% a year for the 200 days since its waiver ended on 2 March 2026. CLNK’s ratio fell from 1.8200 on 30 June to 1.8185 on 18 September, in line with a 0.34% fee paid monthly in arrears. Neither appears in the flow rows.
Is Chainlink included in the CEFI index?
In the composite only. The daily LINK net flow is divided by market capitalisation (close times a 680 million supply constant), smoothed with a 0.3 EWMA and added to the other twelve assets before the composite is z-scored over up to 90 rows. There is no separate per-asset CEFI score for LINK.
Sources and further reading
- Grayscale Chainlink Trust ETF, daily performance file (shares outstanding, NAV, AUM, LINK per share, read 19 September 2026), etfs.grayscale.com; Form 10-K for 2025 (fee history, fee waiver period, 10,000-share basket, staking prohibition, LINK per share at year end), sec.gov.
- Bitwise Chainlink ETF, fund page with shares outstanding, net assets, holdings, NAV history and wallet address (as of 18 September 2026), clnketf.com; Form 10-Q for the quarter ended 30 June 2026 (LINK held, shares, seed basket, fee waiver, fee paid in LINK, staking intention), sec.gov.
- Etherscan, the CLNK trust address for an independent check of the LINK balance, etherscan.io.
- Daily data: Chainlink ETF flows. Internal: how to read Avalanche ETF flows, how to read Sui ETF flows, Hedera ETF explained, what outflows really mean.
For information only. Not investment advice.
 BTC
 ETH
 SOL
 XRP
 HYPE
 HBAR
 AVAX
 DOGE
 LTC
 SUI
 DOT
 BNB
 NEAR
 TRX
 ZEC