No aggregator tracks SUI, so the series comes from three issuers. GSUI has 148 days of history, SUIS and TSUI start on 21 Aug 2026, and $53m of launch capital never counts as flow.
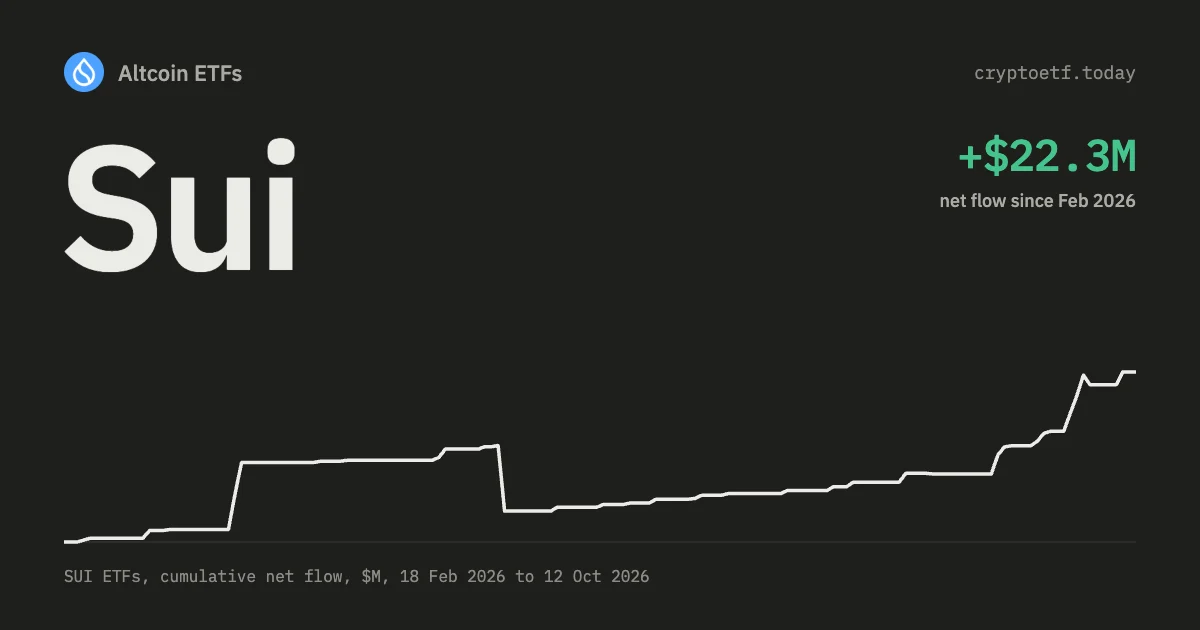
TL;DR. Sui is the only asset on this site with no outside flow series to check against, so every number on the Sui ETF flows page is computed from issuer share counts and NAV. Grayscale's GSUI has a complete daily record since its 18 February 2026 listing (148 trading days to 18 September, 26 with a share-count change, +$9.8m net). Canary's SUIS and 21Shares' TSUI publish no history, so their series begin on 21 August 2026, when daily snapshots started. That's why the cumulative line reads +$12.6m while the three funds hold $71.9m: roughly $53m of launch capital was never a flow, and TSUI's first six months (+$8.3m across 13 orders, recoverable from 21Shares' API) sit outside the series.
Contents · 12 sections
- What the number on the page is
- Why there's no second opinion
- Three funds, three sources
- The formula, and the dating rule that differs by issuer
- Why the history starts late, and what it does to the cumulative line
- Staking: the coin count grows, the share count doesn't
- Reading small-fund spikes
- Why SUI runs a day behind in the morning post
- SUI inside the CEFI composite
- Five ways to misread this data, and a routine
- FAQ
- Sources and further reading

What the number on the page is
A Sui ETF flow is the dollar value of shares an authorised participant created or redeemed on a given day. It's not volume: on 17 September 2026 TSUI traded 38,116 shares on Nasdaq, per 21Shares' data, and its share count didn't move, so the flow was zero. The plumbing is the same as for any spot fund, covered in crypto ETF flows explained; fees, staking terms and custodians are in Sui ETF explained. This piece is about how the data is built and where it's thin.
Two things set SUI apart from the other twelve assets: no aggregator to check against, and two funds with no published history, so the site's own snapshots are the only record.
Why there's no second opinion
For the other twelve assets the site reconciles its calculation against independent data every evening. For Sui no public source publishes flows for GSUI, SUIS or TSUI (checked 21 August 2026). There's nothing to reconcile to.
So the method carries its own credibility. Run on GDOG from listing and checked against independent data, the same formula matched the cumulative to $357 on $12.0m; on GLNK it matched 29 consecutive days to the dollar. The SUI series inherits the method without the check.
Three funds, three sources
| Fund | Daily source | History | Series starts | 18 Sep 2026: shares, NAV, assets |
|---|---|---|---|---|
| GSUI (Grayscale) | Daily spreadsheet: shares outstanding, NAV, market price, AUM, one row per trading day back to the August 2024 private placement | Complete | 18 Feb 2026, first row with a market price | 2,488,900 / $11.79 / $29.3m |
| SUIS (Canary) | Fund page: NAV, net assets, shares outstanding, staking yield, as-of date | None; quarter-ends in 10-Qs | 21 Aug 2026, first snapshot | 1,130,000 / $20.93 / $23.6m |
| TSUI (21Shares) | JSON feed behind the product page: valuation date, units, NAV, total NAV | Full valuation history in the same feed (142 rows to 17 Sep) | 21 Aug 2026, first snapshot | 1,170,000 / $16.16 / $18.9m |
Read 19 September 2026. Neither Canary nor 21Shares discloses a wallet address, so there's no on-chain fallback of the kind how to read Dogecoin ETF flows describes for Bitwise's BWOW.
The formula, and the dating rule that differs by issuer
flow(T) = (shares(T+1) − shares(T)) × NAV(T)
The shift exists because Grayscale's share count dated T reflects orders through the previous day: a Tuesday creation appears in Wednesday's count, so Wednesday minus Tuesday is Tuesday's order at Tuesday's NAV. GSUI's largest day is the clean example: 2,528,900 shares on 26 May 2026, 1,938,900 on 27 May, a 590,000-share redemption worth −$8.58m at the 26 May NAV of $14.55. The June-quarter 10-Q confirms 590,000 shares redeemed in the half-year and no others.
21Shares and Canary publish differently. Their count dated T already includes T's orders (baskets are created "on the NAV of the date" of the order), so the same pair of snapshots yields a flow dated T+1 at NAV(T+1). The site keeps a list of same-day issuers and applies that rule, added after a 13 September 2026 check showed the standard formula landing their flows a day early. On TSUI it lines up: 990,000 units on 10 September, 1,160,000 on 11 September, and the page prints +$2.47m on the 11th (170,000 × $14.51).
So a TSUI or SUIS creation is known the evening it happens; a GSUI creation the next business day. If two funds print on adjacent days, don't read it as one following the other.
Why the history starts late, and what it does to the cumulative line
Grayscale's file has every day since listing. Canary's and 21Shares' pages show today only, so the site could only start recording SUIS and TSUI on the day it began taking snapshots, 21 August 2026. Then there's launch capital, which isn't a flow for any of the three: the series begins on the first day with a market price, and shares that existed before it are treated like seed shares, not creations.
| Fund | Launch capital (not counted) | Activity before the series starts | Cumulative on the page, 18 Sep 2026 |
|---|---|---|---|
| GSUI | 1,386,000 shares issued between the 17 Feb row (212,900) and the 18 Feb row (1,598,900): about $18.6m at the 18 Feb NAV of $13.45 | None; complete from listing | +$9.8m (24 creations, 2 redemptions) |
| SUIS | 1,000,000 seed shares at $25.00 on 17 Feb 2026 ($25.0m), per the 10-Q | 130,000 shares created between listing and 30 Jun 2026, none redeemed (10-Q). The filing doesn't date them; call it $2m–$4m depending on the day | $0.0m (no change in 20 snapshots) |
| TSUI | 530,000 units at $17.37 on 24 Feb 2026 ($9.2m), per 21Shares' feed | 13 share-count changes from 26 Feb to 27 Jul 2026 (11 creations, 2 redemptions), +$8.3m net, all in 21Shares' valuation history | +$2.8m (3 creations since 27 Aug) |
Add it up and the page's +$12.6m understates post-listing net creations by $10m to $12m; the true figure is nearer $23m–$25m. None of that includes the $53m or so that arrived with the listings, which is why fund assets ($71.9m on 18 September) are almost six times the cumulative flow.
Two of the gaps are permanent and one isn't. SUIS's daily record before 21 August exists nowhere public. GSUI's listing block is excluded by design. TSUI's gap is closable: 21Shares' API returns the full history from 24 February and the site's parser already reads that endpoint. As of September 2026 the page's TSUI series still starts on 21 August; if that changes, the SUI cumulative will jump by about $8m in one revision, and it won't mean anyone bought anything that day.
How the page labels this: the "How this is calculated" note states the method, and the API flags SUI with fullHistory: false, the only one of the eight self-computed assets carrying it. The per-fund cumulative column is where to be careful: GSUI's $9.8m is a lifetime number, TSUI's $2.8m and SUIS's $0.0m are since-August numbers, and the table doesn't yet say so in words.
Staking: the coin count grows, the share count doesn't
All three funds stake. Canary reports SUIS at 100.00% (29,358,781 of 29,358,795 SUI at 30 June, per the 10-Q); Grayscale's June 10-Q shows GSUI's whole position as staked SUI; TSUI stakes 70% to 90% by policy and reported 94.75% in its June 10-Q, as staking crypto ETFs compared lays out. Rewards arrive as more SUI in the trust, so the coin count rises with no creation behind it.
A method that read coins would print phantom inflows. The site doesn't read coins for any Sui fund: all three publish shares outstanding, and flow is shares times NAV. Rewards raise NAV and leave the share count alone; the sponsor fee, deducted in SUI, is invisible for the same reason. The coin-based fallback exists only for issuers without a published share count (VanEck), and it adds the fee back rather than modelling staking. Grayscale's numbers show the accrual happening beside the flow series:
| Date | SUI in trust | Shares | SUI per share | Source |
|---|---|---|---|---|
| 31 Mar 2026 | 34.7m | 2,398,900 | 14.46 | 10-Q, March quarter |
| 30 Jun 2026 | 30,266,545.78 | 2,088,900 | 14.49 | 10-Q, June quarter |
| 18 Sep 2026 | about 36.1m | 2,488,900 | 14.50 | Holdings sheet of the daily file (14.50116731) |
SUI per share crept from 14.46 to 14.50 over six months while a 0.35% annual fee came out in coin: net rewards outran the fee, by a little. The coin count meanwhile fell 4.4m between March and June because of the 590,000-share redemption, then rose with creations. The flow series measures the second effect; the per-share ratio measures the first. Only the first is a flow.
Cash distributions (Grayscale amended GSUI's trust agreement on 6 August 2026 to pay at least quarterly; TSUI paid $0.0647 a unit for the June quarter) lower NAV on their date but create no shares, so they aren't flow either.
Reading small-fund spikes
Every share-count change in GSUI's file and in TSUI's history is a multiple of 10,000, the basket size in both prospectuses. At $10 to $20 a share one basket is $100,000 to $200,000, and the biggest days are a few dozen baskets. That scale is why single bars mislead.
| Month (page series, as of 18 Sep 2026) | Net flow | Days with flow | What was in it |
|---|---|---|---|
| Feb 2026 (from 18th) | +$0.50m | 2 | Two 20,000-share GSUI creations, 23 and 24 Feb |
| Mar 2026 | +$9.92m | 4 | 350,000 shares on 26 Mar and 330,000 on 27 Mar: $8.79m, 89% of the month |
| Apr 2026 | +$0.28m | 2 | Two single baskets, then GSUI's longest gap: 13 trading days without a change |
| May 2026 | −$6.65m | 5 | +$1.93m over four creations as NAV hit $18.94 on 11 May, then −$8.58m on 26 May: 590,000 shares, 23% of the fund |
| Jun 2026 | +$1.56m | 4 | Four creations, 20,000 to 50,000 shares each |
| Jul 2026 | +$1.14m | 4 | Four creations, 10,000 to 40,000 shares each |
| Aug 2026 | +$2.18m | 4 | GSUI +$2.02m (100,000 shares on 21 Aug); TSUI enters on 27 Aug with one basket |
| Sep 2026 (to 18th) | +$3.67m | 3 | TSUI 170,000 units on 11 Sep (+$2.47m, its largest order on record), GSUI 100,000 on 14 Sep, TSUI one basket on 15 Sep |
The series is lumpy by construction: 28 non-zero days out of 148, and two March days plus one May day move more dollars than the other 25 combined. The May reversal is what a small fund looks like around a price move: GSUI's NAV went from $13.45 at listing to $18.94 on 11 May, creations arrived on the way up, and one 590,000-share redemption came two weeks later as NAV slid to $14.55. Whether that was a holder taking profit or an AP unwinding an arbitrage, the file can't say. TSUI's 11 September print is 17 baskets in a fund that had moved one at a time since snapshots began; check it against the next fortnight rather than reacting to it.
SUIS is the counter-example: 1,130,000 shares on 30 June, 29 July, 21 August and 18 September. Twenty snapshots, zero baskets. That isn't an outflow; the fund hasn't had an order in the window the site can see.
Why SUI runs a day behind in the morning post
The daily flow post on Telegram and X is generated at 05:50 UTC for the previous trading day. For the other twelve assets a morning pass at 05:30 UTC fills in whatever the issuers hadn't published overnight. SUI has no fill. GSUI's figure for day T needs the T+1 share count, which reaches Grayscale's file after T+1's close and the site's evening collection at 23:10 UTC, about 17 hours after the post. So on the morning of T+1 the GSUI leg of T's flow can't exist yet, and the SUI line is either absent (the post drops zero-flow assets) or shows only what TSUI and SUIS reported.
The page shows the same thing any morning. Read on 19 September, the row for 18 September had TSUI and SUIS at zero and GSUI still empty; the total is provisional until the 19 September count arrives. The finished SUI number for a day is on the flows page by the following evening, and that's the one to quote.
SUI inside the CEFI composite
Sui is one of the thirteen assets in the CEFI composite. Each day's SUI net flow is divided by Sui's market capitalisation, smoothed on its own series and added to the other twelve before the composite is z-scored over a window of at most 90 rows; how the CEFI index is calculated has the method. There's no per-asset CEFI for SUI, and with 28 non-zero days in seven months there shouldn't be: a z-score on a mostly-zero series would jump to an extreme on every basket.
Five ways to misread this data, and a routine
- Comparing cumulative flow with fund assets. +$12.6m against $71.9m doesn't mean the funds are bleeding: $53m was launch capital and $10m–$12m of creations predate the SUIS and TSUI series.
- Treating the SUIS zero as a verdict. It's a zero over twenty snapshots; February to August exists only as a 10-Q total (130,000 shares created, none redeemed).
- Reading one basket as a trend. A 10,000-share day is one AP order, whatever the price. Count baskets and sum the week.
- Assuming all three funds are dated the same way. A TSUI or SUIS creation lands on the day it happens; a GSUI creation lands the next business day.
- Expecting staking to show up. It doesn't. Rewards and the fee move SUI per share, not shares outstanding, and the series is built on shares.
The routine: read the cumulative line first and note where each fund's series starts; treat a TSUI backfill as a re-basing, not an inflow; on daily bars count baskets, sum by week, and note which fund moved (GSUI has 24 creations on record to TSUI's three since August, so a run of TSUI baskets would be a change in who's buying); and for the day just ended, wait for the evening.
The Sui ETF flows page shows the daily net figure, the cumulative line and the per-fund table, updated every business day from the three issuers' own disclosures. It isn't real-time, and for GSUI it's a day behind on purpose.
FAQ
Where does Sui ETF flow data come from?
From the issuers. Grayscale publishes a daily file with GSUI's shares outstanding and NAV back to 2024; Canary's SUIS page and 21Shares' TSUI feed show the current day's shares and NAV. Each fund's flow is the change in share count times NAV. No aggregator covers SUI, so there is no third-party series.
Why does the Sui ETF flow history start on different dates for each fund?
GSUI's daily file gives a complete record from its 18 February 2026 listing. Canary and 21Shares publish only the current day, so SUIS and TSUI are recorded from 21 August 2026, when daily snapshots began. 21Shares' API holds TSUI's full history, so that gap can be filled; SUIS's cannot.
Why is cumulative Sui ETF flow so much smaller than fund assets?
On 18 September 2026 the page showed +$12.6m of cumulative flow against $71.9m of assets. Roughly $53m arrived with the listings (1,386,000 GSUI shares, 1,000,000 SUIS seed shares at $25, 530,000 TSUI units at $17.37) and is not counted as flow, and TSUI's first six months of creations (+$8.3m) fall before its series starts.
Do staking rewards show up as Sui ETF inflows?
No. Rewards add SUI to the trust and raise NAV, and cash distributions lower NAV, but neither changes shares outstanding. The flow series is shares times NAV, so staking is invisible to it. GSUI's SUI per share rose from 14.46 to 14.50 between March and September 2026 with no effect on the flow line.
Why do GSUI and TSUI flows land on different days?
Grayscale's share count dated T reflects orders through the previous day, so a creation is dated and priced on the order day and known the next business day. 21Shares and Canary create shares on the NAV of the order date, so their count dated T already includes T's orders and a TSUI creation is known the same evening.
What was the largest single Sui ETF flow so far?
A 590,000-share GSUI redemption on 26 May 2026, worth −$8.58m at that day's NAV of $14.55 and equal to 23% of the fund's shares. The largest creations were 350,000 and 330,000 GSUI shares on 26 and 27 March 2026 ($8.79m together). TSUI's largest was 170,000 units on 11 September 2026 (+$2.47m).
Sources and further reading
- Grayscale Sui Staking ETF, daily performance and holdings file, etfs.grayscale.com; Form 10-Q for the quarter ended 30 June 2026 (shares issued and redeemed, SUI held, 10,000-share basket, staking fee, August distribution amendment), sec.gov.
- Canary Staked SUI ETF, Form 10-Q for the quarter ended 30 June 2026 (1,000,000 seed shares at $25.00, 1,130,000 shares created and none redeemed since inception, 29,358,781 SUI staked), sec.gov; fund page with NAV, net assets and shares outstanding, canaryetfs.com.
- 21Shares Sui ETF, product page and valuation history, 21shares.com; Form 10-Q for the quarter ended 30 June 2026 (staked share, cash distribution), sec.gov.
- Nasdaq listing circular for SUIS, first trading day 18 February 2026, nasdaqtrader.com.
- Daily data: Sui ETF flows. Internal: how to read Hyperliquid ETF flows, Sui ETF explained, staking crypto ETFs compared.
For information only. Not investment advice.
 BTC
 ETH
 SOL
 XRP
 HYPE
 LINK
 HBAR
 AVAX
 DOGE
 LTC
 DOT
 BNB
 NEAR
 TRX
 ZEC