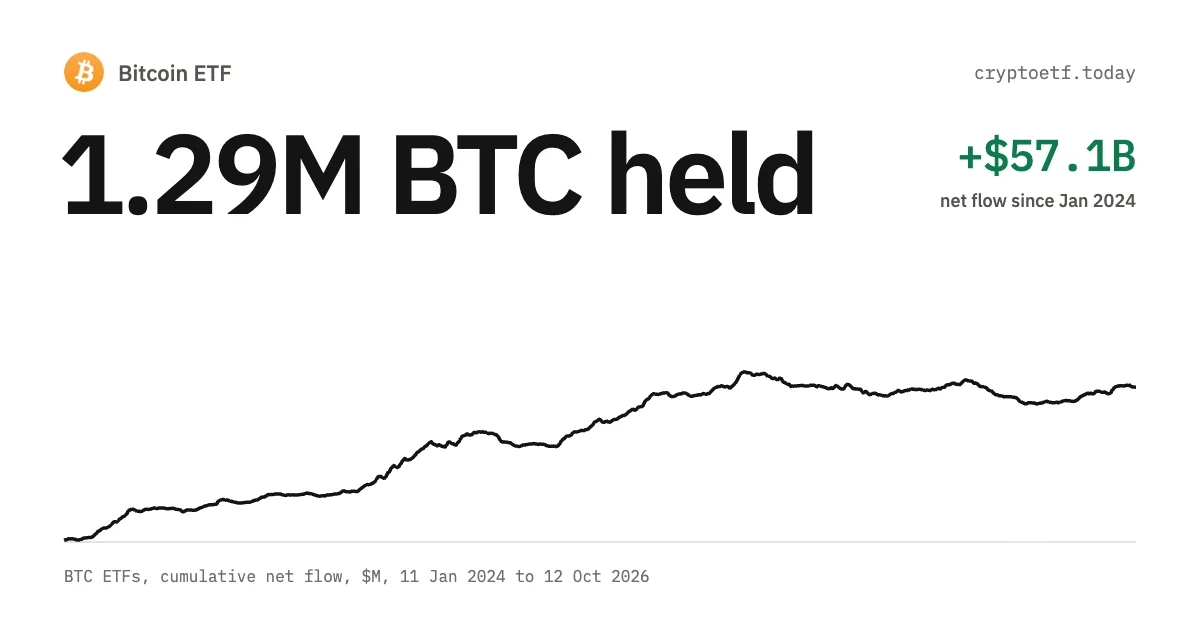
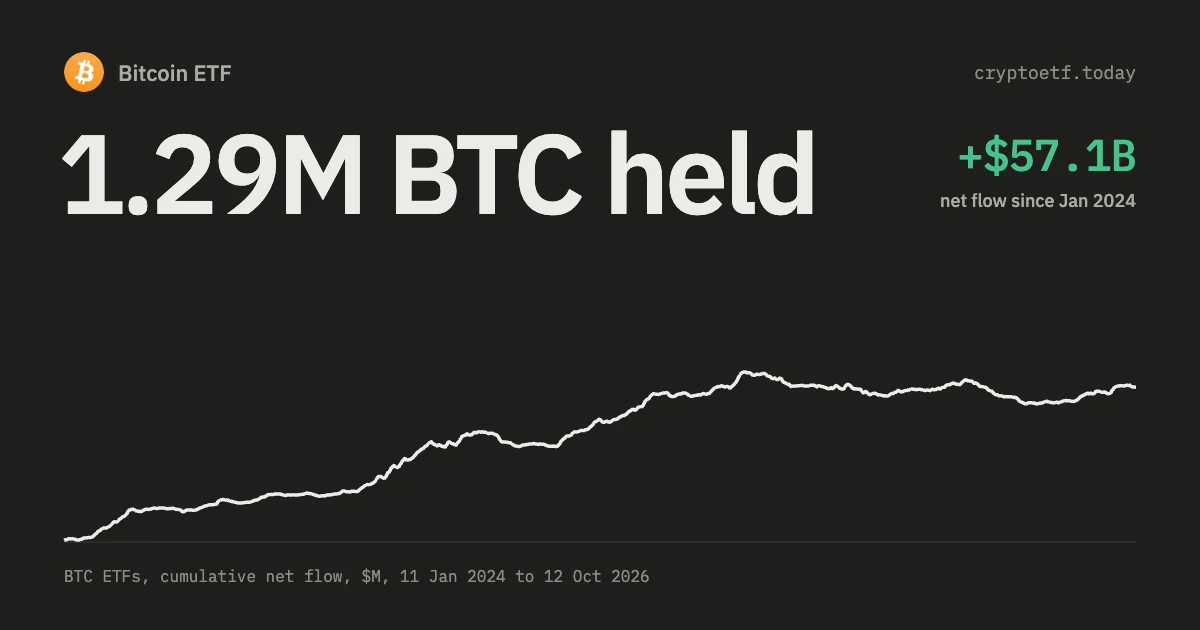
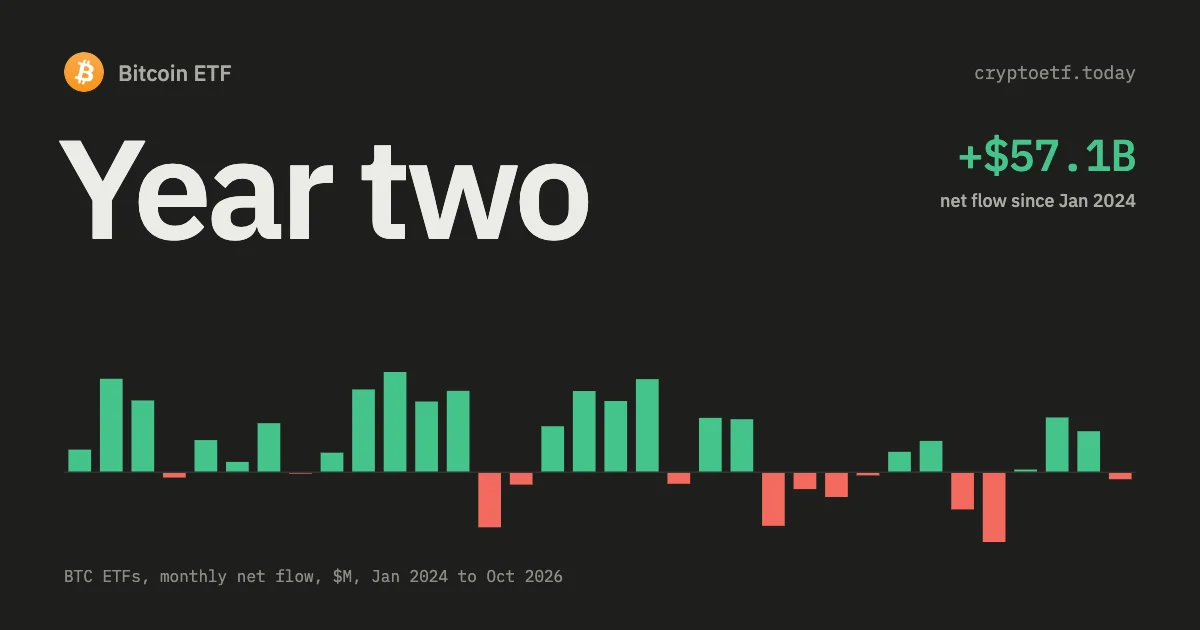
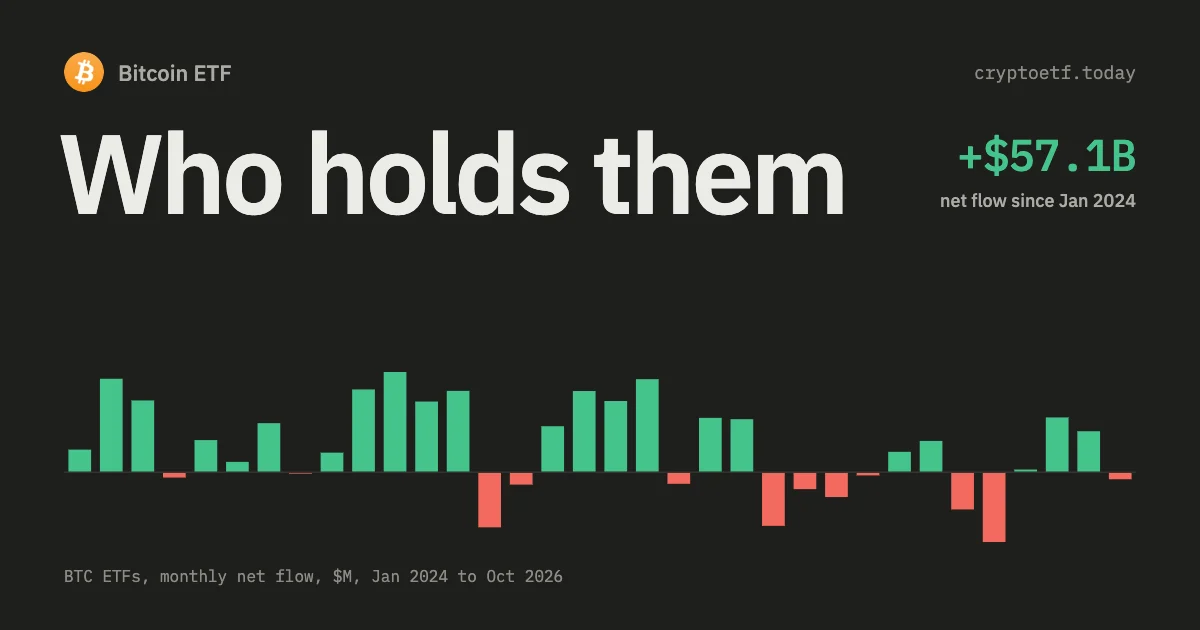
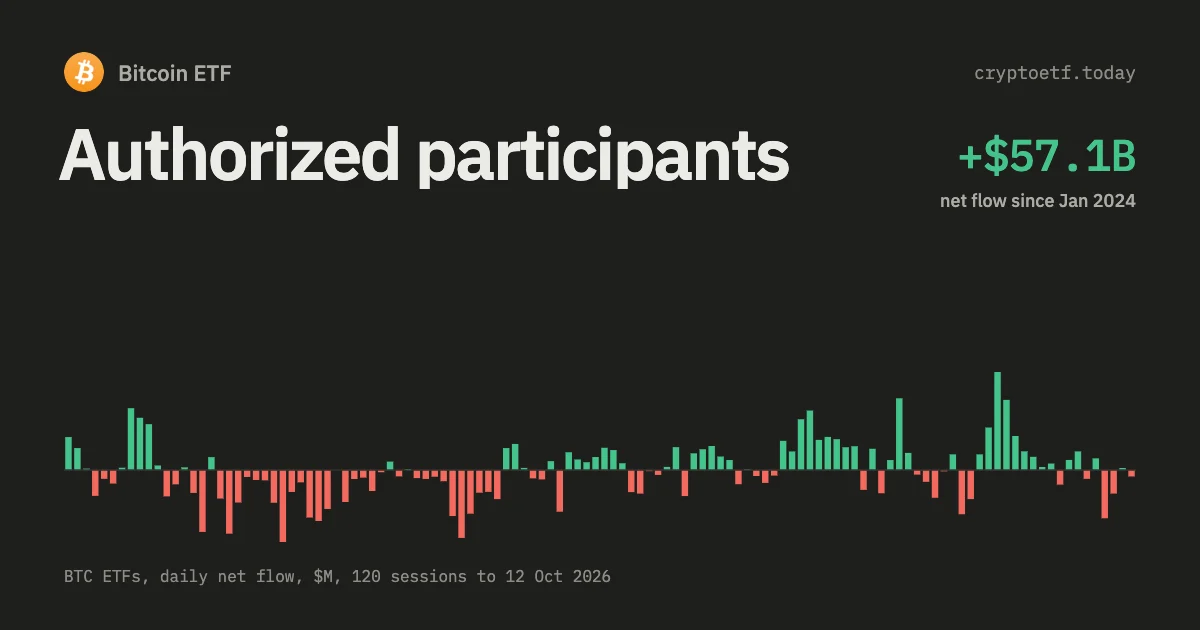
US spot Bitcoin ETFs held $71.42bn at the June 2026 quarter end. Of the category’s growth since launch, $56.9bn is money investors handed over and only $27.5bn is price.
TL;DR. Twelve US spot Bitcoin ETFs held 1,210,299 bitcoin worth $71.42bn at the 30 June 2026 quarter end, according to their own Form 10-Q filings. Assets are not the same thing as money raised: since the first session on 11 January 2024 the category has taken in $56.94bn of net flow, and our reconstruction puts total AUM growth over the same window at about $84.5bn. So roughly two thirds of the growth is new money and one third is price. The split flips sign by year. 2024 added $75.1bn of assets on $35.3bn of flow. 2025 added only $11.6bn of assets on $21.4bn of flow, meaning investors lost money on the way in. And almost all of the category's cumulative price gain sits on the ~577k bitcoin that GBTC brought in on day one, not on the coins bought with the $56.9bn.
المحتويات · 10 أقسام
- AUM and inflow are two different measurements
- How big is the category, actually
- Splitting the growth: price versus new money
- Where the price gain actually landed
- Market share: IBIT up, GBTC down, every single quarter
- What the funds paid versus what they hold
- What "ETFs hold 5.8% of all bitcoin" leaves out
- How to reproduce this, and where it breaks
- Frequently asked questions
- Sources and further reading

AUM and inflow are two different measurements
Most coverage of this category treats the two as interchangeable. They aren't, and the gap between them is where the interesting reading lives.
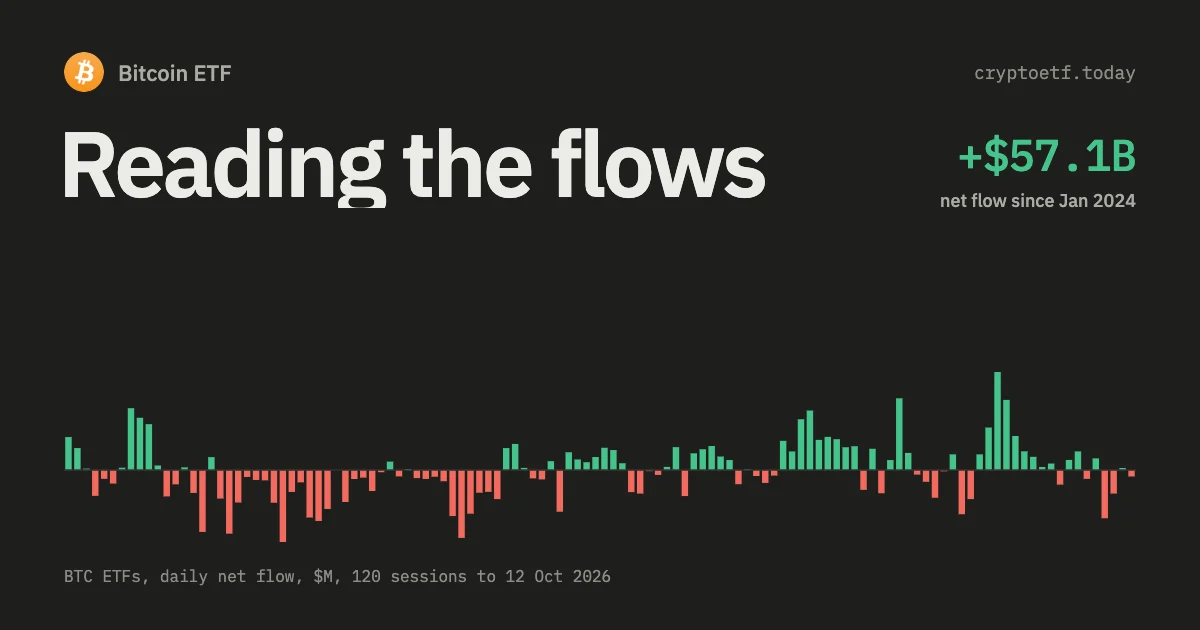
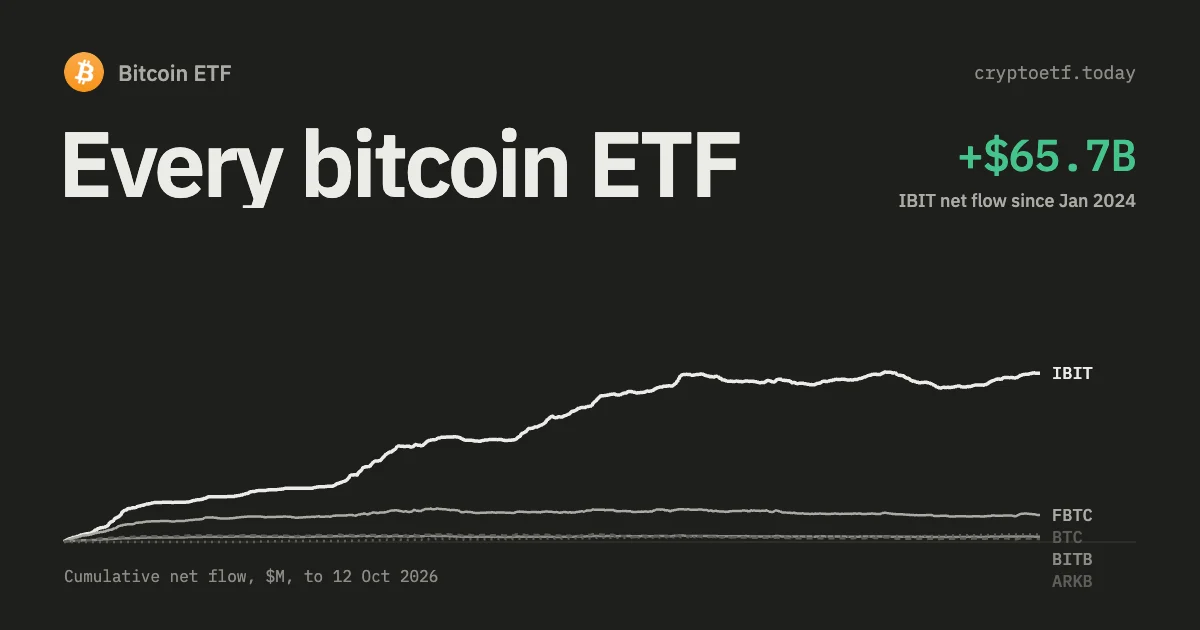
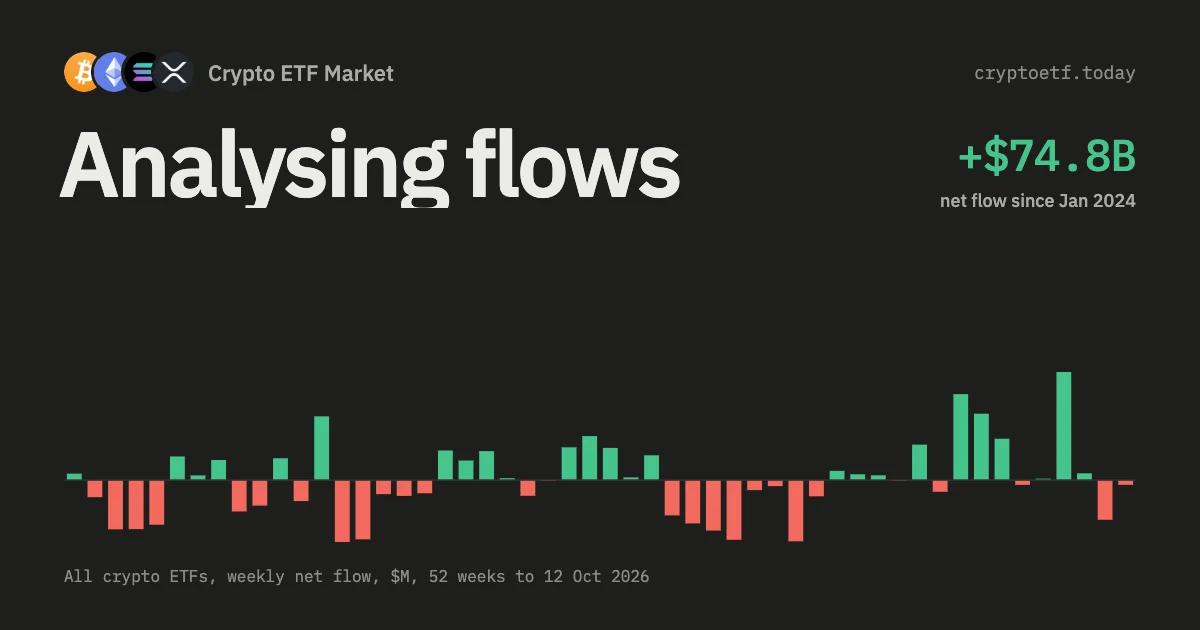
Cumulative net flow is the sum of every creation minus every redemption, in dollars, on the day it happened. It's a sales scorecard. It never moves once a day closes.
Assets under management is what the funds hold right now, marked at today's bitcoin price. It moves every second the market is open, whether or not a single share is created.
The identity that connects them is simple: the change in AUM over any period equals the net flow in that period plus the revaluation of everything already inside. Coins sold to pay the sponsor's fee are the small third term. Nobody publishes the split, because doing it needs a daily flow series and a coin count from filings at the same time. We have both, so this page works it out.
New to the wrapper itself? What a Bitcoin ETF is covers it, and the fund directory lists every US spot product.
How big is the category, actually
At the last quarter end with filed financials, 30 June 2026, the twelve tracked funds looked like this. Everything in the table comes from each trust's Form 10-Q for that quarter. Fair value per coin differs slightly between funds because they use different principal markets: IBIT marked bitcoin at $59,101.49, GBTC at $58,745.18 off Crypto.com's 4pm New York print.
| Ticker | Bitcoin held | Net assets | Share of category | Source |
|---|---|---|---|---|
| IBIT (BlackRock) | 734,261 | $43.39bn | 60.7% | 10-Q, 30 Jun 2026 |
| FBTC (Fidelity) | 174,383 | $10.30bn | 14.4% | 10-Q, 30 Jun 2026 |
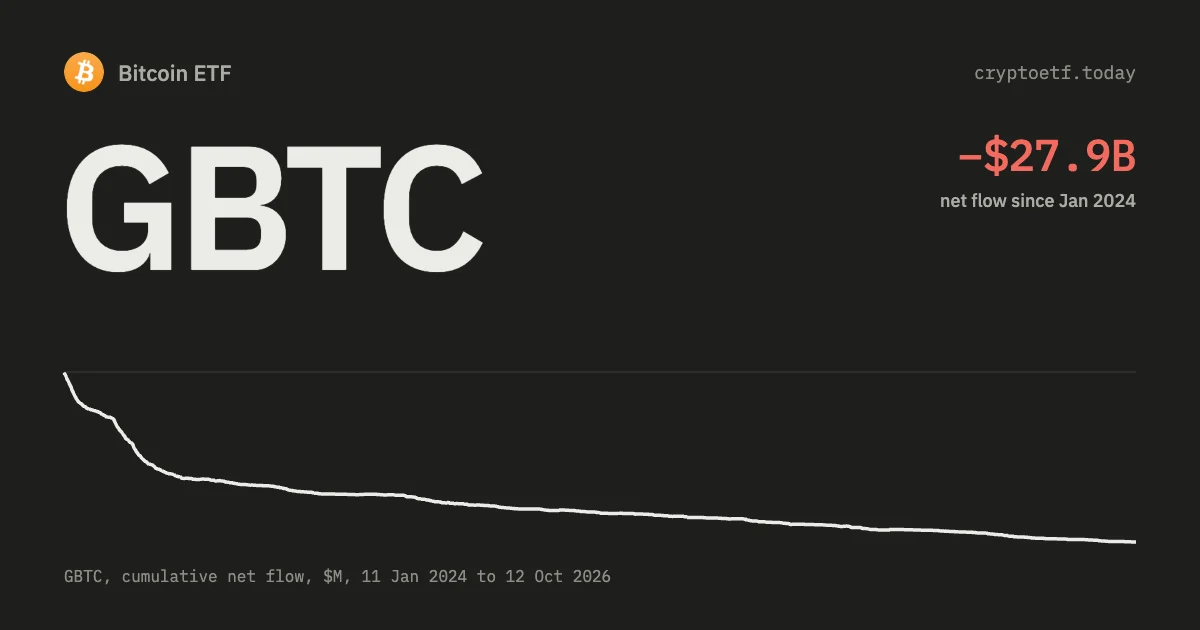
| GBTC (Grayscale) | 138,506 | $8.14bn | 11.4% | 10-Q, 30 Jun 2026 |
| BTC (Grayscale mini) | 54,280 | $3.19bn | 4.5% | 10-Q, 30 Jun 2026 |
| BITB (Bitwise) | 36,208 | $2.13bn | 3.0% | 10-Q, 30 Jun 2026 |
| ARKB (ARK 21Shares) | 32,178 | $1.89bn | 2.6% | 10-Q, 30 Jun 2026 |
| HODL (VanEck) | 16,241 | $0.96bn | 1.3% | 10-Q, 30 Jun 2026 |
| BRRR (CoinShares) | 5,864 | $342m | 0.5% | 10-Q, 30 Jun 2026 |
| EZBC (Franklin) | 5,664 | $335m | 0.5% | 10-Q, 30 Jun 2026 |
| BTCO (Invesco Galaxy) | 5,345 | $316m | 0.4% | 10-Q, 30 Jun 2026 |
| MSBT (Morgan Stanley) | 5,059 | $299m | 0.4% | 10-Q, 30 Jun 2026 |
| BTCW (WisdomTree) | 2,310 | $136m | 0.2% | 10-Q, 30 Jun 2026 |
| Total | 1,210,299 | $71.42bn | 100% | sum of the above |
One honest gap in that total. A thirteenth US-listed fund holds spot bitcoin, Osprey's OBTC, uplisted to Nasdaq on 19 December 2025 at a 0.49% fee with roughly $55m of assets. This site's flow series doesn't cover it, so it isn't in any figure on this page. At that size it changes the category total by less than a tenth of a percent, but a number that says "all US spot Bitcoin ETFs" and quietly means twelve of thirteen deserves the footnote.
Note how thin the tail is. The bottom six funds together hold $1.4bn, about a thirtieth of IBIT. Category AUM is, to a first approximation, a BlackRock number.
Splitting the growth: price versus new money
Here's the method, so you can check it. We take our daily flow series, convert each day's dollar figure into coins at that day's bitcoin price, cumulate, and anchor the resulting coin count so that it matches the filed 1,210,299 bitcoin on 30 June 2026. That fixes the starting base: about 576,700 coins that were already inside the wrapper before the first creation, which is essentially the Grayscale trust that uplisted on day one. AUM at any date is then coins times price, and the revaluation term is whatever the change in AUM isn't explained by flow.
| Period | AUM start | AUM end | Change | Net flow | Revaluation |
|---|---|---|---|---|---|
| 11 Jan – 31 Dec 2024 | $26.85bn | $101.95bn | +$75.10bn | +$35.25bn | +$39.85bn |
| 2025 | $101.95bn | $113.58bn | +$11.63bn | +$21.35bn | −$9.72bn |
| 1 Jan – 30 Jun 2026 | $113.58bn | $72.93bn | −$40.65bn | −$5.39bn | −$35.26bn |
| 1 Jul – 22 Sep 2026 | $72.93bn | $111.33bn | +$38.40bn | +$5.74bn | +$32.66bn |
| Whole life | $26.85bn | $111.33bn | +$84.48bn | +$56.94bn | +$27.54bn |
Three readings come out of that table.
2024 was the only year where both terms pulled the same way. Bitcoin went from $46,563 on the first session to $92,782 at year end, and the wrapper took in $35.3bn while that happened. Assets nearly quadrupled. That year is the one everybody remembers, and it's the reason the "fastest-growing ETF category ever" line stuck.
2025 is the year the two terms fought. Investors handed over $21.35bn and the category's assets grew by $11.63bn. The missing $9.7bn is mark-to-market loss on money that arrived at prices above where the year closed. A reader looking only at the flow print would have concluded 2025 was a strong year. A reader looking only at AUM would have concluded it was a weak one. Both were reading half the picture.
2026 has been almost pure price. Through 22 September the category's net flow is a rounding error on a $100bn base, while AUM went from $113.6bn to a low near $73bn and back above $111bn. Bitcoin did all of it. If you want the mechanics of why a flat flow tape can hide large rotation underneath, how to analyse ETF flows without fooling yourself covers the normalisation traps.
Our reconstruction puts 30 June 2026 AUM at $72.93bn against the $71.42bn the filings report, an overshoot of 2.1%. That's the error band on every reconstructed figure above, and it comes from converting flows at a daily price stamp rather than at execution.
The peak nobody quotes
Category assets topped out near $167bn on 7 October 2025, when bitcoin printed $124,674. From there to the 30 June 2026 quarter end, AUM fell 57% while cumulative net flow barely moved. Any headline of the form "Bitcoin ETFs lost $90bn" over that window was describing the price of bitcoin, not an exodus.
Where the price gain actually landed
This is the part that surprised us. The $27.54bn of lifetime revaluation is not spread evenly over the coins in the wrapper. Split it two ways:
- The launch base. About 576,700 coins were already inside on 11 January 2024, when bitcoin was $46,563. At $86,416 on 22 September 2026 those coins are worth $22.98bn more than they were. That's 83% of the entire category's price gain.
- Everything bought since. The $56.94bn of net flow bought roughly 711,600 coins at a weighted average of $80,021. At $86,416 that block is up $4.55bn, or 8.0%.
Read that twice. The money that actually chose to come in over 676 trading sessions is up eight percent, in aggregate, after nearly three years. The rest of the gain belongs to holders who were already there, mostly through a closed-end trust that had no redemption mechanism until the conversion. "Bitcoin ETFs are up 86% since launch" is a statement about bitcoin. It is not a statement about what the average dollar in these funds has earned.
That's also why the aggregate underwater position is so large at the fund level, which the filings show directly in the next section.
Market share: IBIT up, GBTC down, every single quarter
Applying the same reconstruction per issuer gives a quarterly share series. Shares are of the category's coin count, which is the cleaner denominator because it doesn't move with price.
| Quarter end | Category BTC | IBIT BTC | IBIT share | GBTC BTC | GBTC share |
|---|---|---|---|---|---|
| Q1 2024 | 795,494 | 252,874 | 31.8% | 293,124 | 36.8% |
| Q2 2024 | 829,985 | 307,560 | 37.1% | 236,998 | 28.6% |
| Q3 2024 | 899,669 | 367,535 | 40.9% | 210,811 | 23.4% |
| Q4 2024 | 1,098,860 | 554,769 | 50.5% | 195,927 | 17.8% |
| Q1 2025 | 1,102,431 | 579,409 | 52.6% | 185,123 | 16.8% |
| Q2 2025 | 1,227,674 | 701,029 | 57.1% | 177,561 | 14.5% |
| Q3 2025 | 1,304,359 | 774,553 | 59.4% | 169,862 | 13.0% |
| Q4 2025 | 1,283,798 | 776,620 | 60.5% | 158,995 | 12.4% |
| Q1 2026 | 1,284,009 | 793,210 | 61.8% | 150,057 | 11.7% |
| Q2 2026 | 1,210,299 | 746,750 | 61.7% | 134,569 | 11.1% |
| 22 Sep 2026 | 1,288,335 | 809,901 | 62.9% | 123,933 | 9.6% |
Two checks against the filings, so you know how much to trust the series. At 30 June 2026 the reconstruction gives IBIT 746,750 coins against the 734,261 in its 10-Q, 1.7% high; GBTC 134,569 against a filed 138,506, 2.8% low. At 31 December 2025 the reconstruction has IBIT 0.8% high and GBTC 4.0% low. Directionally the series is solid, to a couple of percent. Treat the share column as accurate to about one point, not one tenth of a point.
The shape is the story anyway. IBIT crossed GBTC inside the first quarter and has taken share in nine of ten quarters since. GBTC has given up share in every single quarter of its ETF life, and passed below 10% of the category's coins in September 2026. Two forces did that: the trapped arbitrage capital that walked out once redemption existed, and a 1.50% fee against IBIT's 0.25%. The discount history behind it is in our GBTC analysis.
You can watch this split update daily on the Bitcoin ETF flows page, which breaks the headline print out by issuer.
What the funds paid versus what they hold
The clearest proof that AUM isn't inflow sits in the schedules of investment, where trusts report cost alongside fair value. Two funds, same asset, same quarter end:
| Line | IBIT | GBTC |
|---|---|---|
| Bitcoin held, 30 Jun 2026 | 734,261 | 138,506 |
| Cost of investment | $61.00bn | $2.55bn |
| Fair value | $43.40bn | $8.14bn |
| Unrealised position | −$17.61bn | +$5.58bn |
| Average cost per coin | $83,081 | $18,442 |
| Cost per coin, 31 Dec 2024 | $67,715 | n/a (cost restated on contribution) |
BlackRock's fund is carrying its book 28.9% below what it paid, and its average entry has ratcheted from $67,715 at the end of 2024 to $83,081 eighteen months later, because creations kept arriving as bitcoin climbed. Grayscale's flagship is the mirror image: coins that entered the trust between 2013 and 2023 at an average of $18,442 sit on a $5.58bn unrealised gain even after the price collapse.
Same coin, same custodian, same quarter, and a 4.5x difference in cost basis. Any sentence that treats "$71bn in Bitcoin ETFs" as a measure of investor profit or investor conviction is ignoring that the $71bn was assembled at wildly different prices by different cohorts.
The third term: coins sold to pay the fee
Sponsor fees in these trusts are paid in bitcoin, so they shrink the coin count without any investor selling. In the first half of 2026 IBIT sold 1,062 bitcoin to pay expenses and GBTC distributed 1,139.5 to its sponsor. Those two funds alone burned 2,201 coins in six months, worth about $130m at the June quarter-end mark. Annualised across the category that's a low four-figure number of coins a year, a rounding error against $84bn of AUM change but not against the tail funds' own balances. It's also the reason the flow-derived coin count drifts above the filed one over time, which is most of the 1.7% gap on IBIT above.
What "ETFs hold 5.8% of all bitcoin" leaves out
1,210,299 coins is 5.76% of the 21 million that will ever exist, and about 6.0% of the roughly 20.1 million mined so far. Both numbers get quoted as if they measured how much of bitcoin's float the ETFs control. They don't, for three reasons.
- A large slice of mined supply can't move. Widely cited chain analyses put permanently lost coins in the 3 to 4 million range, including early holdings that haven't moved since the first years. Against reachable supply the ETF share is closer to 7%, not 6%.
- Corporate treasuries and exchanges hold more. Listed companies that run a bitcoin treasury strategy, plus coins sitting in exchange wallets, account for a further large block that's equally out of circulation on any given day. The ETFs are one of several sinks, not the sink.
- The share moves without anyone buying. New coins get mined every ten minutes, so the denominator grows on its own. Post-halving issuance is about 164,000 coins a year, and the ETFs' net coin count grew by roughly 78,000 over the twelve months to September 2026. On that arithmetic the category's percentage share can fall in a year when it adds coins.
The honest version is narrower and more useful: US spot ETFs are the largest identifiable pool of bitcoin with published, auditable balances, reported quarterly in filings anyone can read. "They control 6% of bitcoin" is not that claim.
How to reproduce this, and where it breaks
Everything above uses two inputs. The first is each trust's Form 10-Q, which gives coin count, cost and fair value at each quarter end. The second is our own daily flow series, which runs from the first session on 11 January 2024 through 22 September 2026, 676 trading days, and is summed rather than read from a stored total.
Four limits worth stating plainly.
- Filings lag. The June 2026 10-Qs landed in August. Between quarter ends, any AUM figure is an estimate, including ours.
- Flow-to-coin conversion is approximate. We use a daily price stamp, not execution prices. That's where the 2% error band comes from, and it compounds slightly with fee coins.
- The tracker is daily, not real time. A session's flows land in the evening. Weekends and US holidays are empty rows, not zero-flow days.
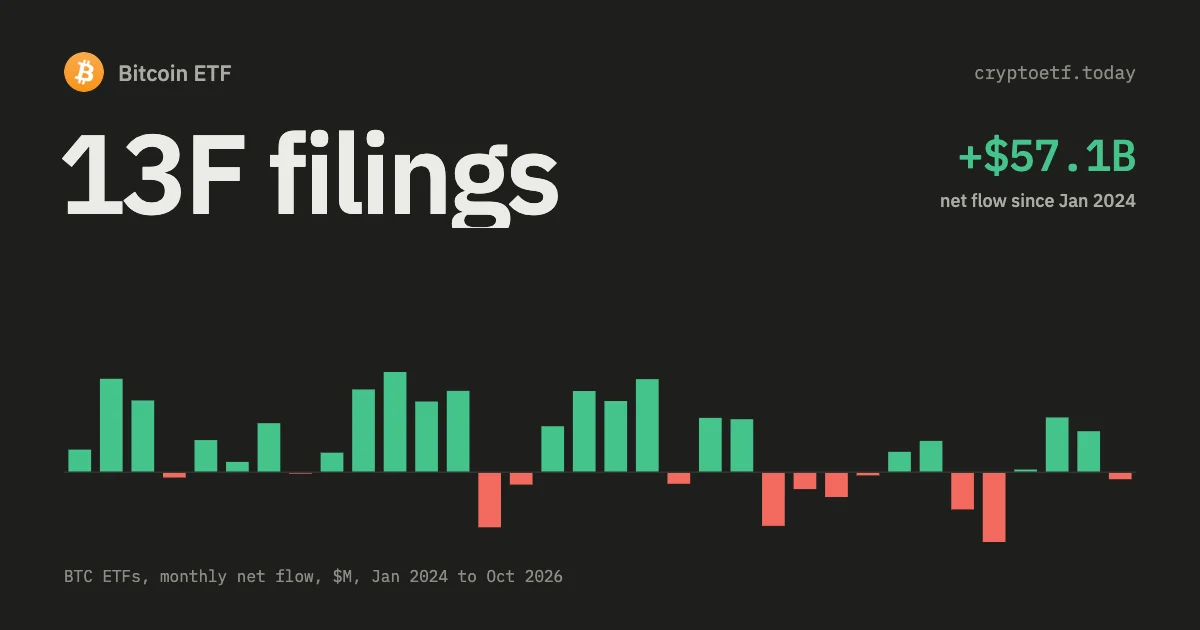
- Holder composition isn't in any of this. Neither flows nor 10-Qs say who owns the shares. The only public window is Form 13F, which covers institutional managers above the reporting threshold and nobody else, and which reports positions 45 days after quarter end. Anyone publishing a clean pie chart of "retail versus institutional" ETF assets is estimating, not reporting. How to read 13F filings and the institutional holder map cover what that data can and can't support.
For the fund-by-fund view with latest prices and full flow history, the funds directory has a page per product. For the year-by-year performance read that sits alongside this one, see Bitcoin ETF year-two performance.
Frequently asked questions
What is the total AUM of US Bitcoin ETFs?
The twelve tracked US spot Bitcoin ETFs held 1,210,299 bitcoin worth $71.42bn at the 30 June 2026 quarter end, per their Form 10-Q filings. Our reconstruction puts the category above $111bn on 22 September 2026, after bitcoin recovered from $59,101 to $86,416. A thirteenth listed fund, Osprey’s OBTC at roughly $55m, sits outside this site’s series.
How much of Bitcoin ETF AUM growth is inflow and how much is price?
Over the whole life of the category, from 11 January 2024 to 22 September 2026, AUM grew about $84.5bn. Net flow contributed $56.94bn of that and revaluation $27.54bn, so roughly two thirds is new money. The split flips by year: 2024 was +$35.3bn flow and +$39.9bn price, while 2025 was +$21.4bn flow and −$9.7bn price.
Which Bitcoin ETF has the largest AUM?
BlackRock’s IBIT, by a wide margin. It held 734,261 bitcoin worth $43.39bn on 30 June 2026, 60.7% of all bitcoin held by US spot ETFs. Fidelity’s FBTC is second at 174,383 coins and $10.30bn, and Grayscale’s GBTC third at 138,506 coins and $8.14bn. The bottom six funds together hold $1.4bn.
Why did Bitcoin ETF AUM fall in 2026 if flows were not negative?
Because price did the work. Bitcoin peaked near $124,674 on 7 October 2025 and traded at $59,101 at the June 2026 quarter end, a 53% drawdown. Category assets fell from about $167bn to $71.4bn over that window while cumulative net flow barely moved. Headlines describing that as investors pulling money out were describing the coin price.
Are Bitcoin ETF investors in profit?
In aggregate, barely. The $56.94bn of net flow bought roughly 711,600 coins at a weighted average of $80,021, against $86,416 on 22 September 2026, so that block is up about 8%. IBIT’s own 10-Q shows the sharper version: $61.00bn of cost against $43.40bn of fair value on 30 June 2026, an average entry of $83,081 per coin and a $17.61bn unrealised loss.
What percentage of all bitcoin do the ETFs hold?
1,210,299 coins is 5.76% of the 21 million cap and about 6.0% of the roughly 20.1 million mined to date, as of 30 June 2026. Against supply that can actually move, after the 3 to 4 million coins commonly estimated as permanently lost, the share is nearer 7%. The percentage also drifts down on its own, because roughly 164,000 new coins are mined each year.
How do you calculate Bitcoin ETF AUM between quarterly filings?
Take the coin count from the last 10-Q, add each subsequent day’s net flow converted to coins at that day’s price, subtract the coins sold to pay sponsor fees, then multiply by the current price. Our version of that reconstruction sits 2.1% above the filed figure at the 30 June 2026 check point, which is a fair error band for anything computed this way.
Sources and further reading
- iShares Bitcoin Trust ETF, Form 10-Q for the quarter ended 30 June 2026: 734,261 bitcoin, $61,003,144,500 of cost against $43,395,920,710 of fair value, and 1,062 coins sold to pay expenses in the half year.
- Grayscale Bitcoin Trust ETF, Form 10-Q for the quarter ended 30 June 2026: 138,505.76 bitcoin, $2,554,268 thousand of cost, the $58,745.18 principal-market mark and 1,139.5 coins distributed for the sponsor’s fee.
- EDGAR filing history for the iShares Bitcoin Trust ETF: every quarterly report, for checking later quarters than the one used here.
- EDGAR filing history for the Grayscale Bitcoin Trust ETF: the full series back to the 2024 uplisting.
- SEC press release, 29 July 2025: in-kind creations and redemptions permitted for crypto ETPs: the rule change behind the in-kind lines in the trusts’ bitcoin activity tables.
بيانات مباشرة حول هذا الموضوع
لأغراض إعلامية فقط. ليست نصيحة استثمارية.

 ETH
 SOL
 XRP
 HYPE
 LINK
 HBAR
 AVAX
 DOGE
 LTC
 SUI
 DOT
 BNB
 NEAR
 TRX
 ZEC