IBIT's daily return correlates +0.43 with the S&P 500 over 567 sessions. The 30-day version of that number has run from -0.09 to +0.79, which is why almost every published figure is unreliable.
TL;DR. Across 567 sessions from 18 June 2024 to 22 September 2026, the daily return of IBIT correlates +0.43 with the S&P 500 and +0.44 with the Nasdaq Composite. That's an R² of 0.18, so roughly four fifths of what a Bitcoin ETF does on a given day has nothing to do with the stock market. The number is also unstable: measured on 30-day windows it ran from −0.09 (4 March 2025) to +0.79 (12 November 2025). What moves it is the size of the equity move rather than its direction. On the 23 sessions where the S&P 500 moved 2% or more the correlation was +0.61, against +0.38 on the calm remainder, and downside beta (0.85) was lower than upside beta (1.12). On our own flow data, the BTC and ETH tapes move together (+0.49, same sign on 71% of days) while BTC and XRP don't (−0.06, same sign on 51%).
Mục lục · 12 mục
- How this was measured, and why the instrument matters
- The headline number: +0.43
- The correlation isn't a constant
- Why a 30-day correlation tells you almost nothing
- Does correlation really spike when equities fall?
- The price-column trap, and what it does to published numbers
- What flows say about the equity market
- Flows across crypto assets, which is where the real correlation lives
- Bitcoin against gold, measured the same way
- What this changes for a portfolio
- FAQ
- Sources and further reading

How this was measured, and why the instrument matters
Most published "bitcoin vs stocks" correlations quote spot bitcoin, which trades around the clock, against an index that trades six and a half hours. That mismatch alone moves the answer. The question here is about the ETF, so we used the ETF.
- Bitcoin side: daily closes of IBIT, 17 June 2024 through 22 September 2026, 607 trading days. IBIT prints only between 09:30 and 16:00 ET, the same window the index trades.
- Equity side: daily closes of the S&P 500 and the Nasdaq Composite from the St. Louis Fed's FRED database.
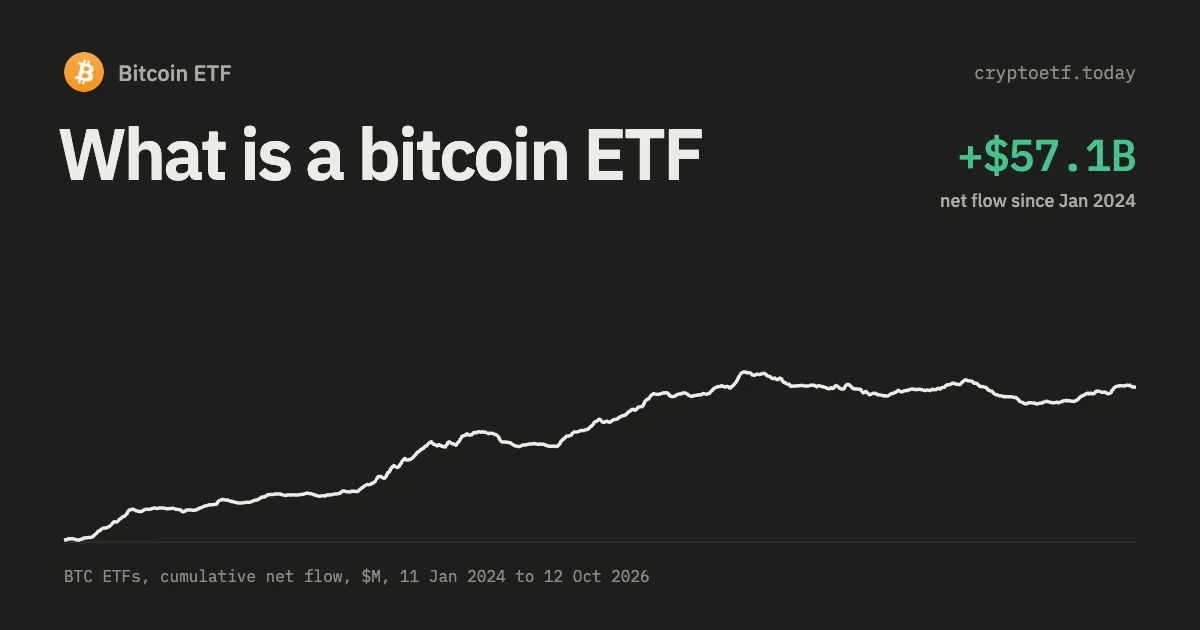
- Flow side: our own daily net-flow series for BTC, ETH, SOL and XRP, the BTC tape running from 11 January 2024. Cumulative BTC net flow over that window is $56.9bn, of which 2026 to date has added just $349m across 181 sessions.
- Every figure is a Pearson correlation on simple daily returns, unadjusted, unless the table says otherwise.
One thing we deliberately did not use is our own bitcoin price column. It's a 07:00 UTC snapshot, struck hours before the US session it sits next to, so correlations built on it are off by one session. That gets its own section below. If you're new to the product itself, start with what a Bitcoin ETF is.
The headline number: +0.43
| Pair (daily returns) | Correlation | R² | Sessions |
|---|---|---|---|
| IBIT vs S&P 500 | +0.43 | 0.18 | 567 |
| IBIT vs Nasdaq Composite | +0.44 | 0.19 | 567 |
| FBTC vs S&P 500 | +0.42 | 0.18 | 567 |
| GBTC vs S&P 500 | +0.42 | 0.18 | 567 |
| IBIT vs FBTC | +1.00 | 0.99 | 606 |
Source: our candle store and FRED, 18 June 2024 to 22 September 2026. The last row is the control: spot Bitcoin ETFs from different issuers are the same instrument to three decimal places (+0.997), so nothing here depends on which fund you pick. Fees change your return, not your correlation, and they're compared in Bitcoin ETF expense ratios compared.
The R² of 0.18 is the number worth carrying around: squared, +0.43 says the S&P explains 18% of a Bitcoin ETF's daily return and leaves 82% to something else. Beta says it from the other side. IBIT's beta to the index is 1.24, but its annualised volatility was 46.9% against the index's 16.0%, and a high-volatility asset with a middling correlation lands near beta one by arithmetic, not by behaving like a stock.
Three sessions show what the other 82% looks like. On 11 November 2024 IBIT gained 15.55% while the S&P moved +0.10%. Bitcoin's own news cycle cost it 13.99% on 5 February 2026 against an index down 1.23%. And on 5 August 2024, during the yen carry unwind, IBIT fell 12.30% while the index fell 3.00%. Two of the three are crypto-specific days the equity market barely registered.
The correlation isn't a constant
A single number for a three-year window hides what matters. Cut the same data by quarter and it moves more than 25 points.
| Quarter | Sessions | IBIT vs S&P 500 | IBIT vs Nasdaq |
|---|---|---|---|
| 2024 Q3 | 64 | +0.47 | +0.42 |
| 2024 Q4 | 64 | +0.45 | +0.40 |
| 2025 Q1 | 60 | +0.45 | +0.50 |
| 2025 Q2 | 62 | +0.41 | +0.44 |
| 2025 Q3 | 64 | +0.42 | +0.40 |
| 2025 Q4 | 64 | +0.62 | +0.64 |
| 2026 Q1 | 61 | +0.57 | +0.56 |
| 2026 Q2 | 62 | +0.42 | +0.45 |
| 2026 Q3 (to 22 Sep) | 58 | +0.36 | +0.37 |
Source: our candle store and FRED; the eight opening sessions of June 2024 are too short to measure and sit outside the quarterly cut. The range, +0.36 to +0.62, is wider than the gap most allocation papers treat as meaningful between whole asset classes. Anyone publishing "bitcoin correlates 0.62 with equities" in January 2026 was right for that quarter and wrong nine months later.
Why a 30-day correlation tells you almost nothing
Rolling correlation is the standard chart and 30 days the standard window, which is also where the most confident-looking nonsense comes from. Here's what each window length does over the same history.
| Window | Windows | Mean | Std dev | Lowest (date) | Highest (date) |
|---|---|---|---|---|---|
| 30 sessions | 538 | +0.45 | 0.16 | −0.09 (4 Mar 2025) | +0.79 (12 Nov 2025) |
| 60 sessions | 508 | +0.47 | 0.10 | +0.18 (31 Jul 2025) | +0.67 (10 Nov 2025) |
| 90 sessions | 478 | +0.47 | 0.08 | +0.25 (21 Aug 2025) | +0.63 (11 Feb 2026) |
| 252 sessions | 316 | +0.45 | 0.05 | +0.38 (30 Sep 2025) | +0.53 (17 Jun 2026) |
Source: our candle store and FRED, rolling windows ending 18 June 2024 to 22 September 2026. Read the first and last rows together. The mean is identical to a rounding error, +0.45 either way, but the 30-day version spans 88 points of range and the one-year version spans 15. Three of the 538 monthly windows came out negative.
Pick a month at random and the 30-day reading lands between +0.12 and +0.69 nineteen times out of twenty, an interval wide enough to support both "bitcoin is a Nasdaq proxy" and "bitcoin is uncorrelated" from one dataset, depending only on which month you screenshot. The window ending 4 March 2025 read −0.09, the one ending 12 November 2025 read +0.79, and the last one in the sample reads +0.42. The rule that follows: don't act on a correlation built from fewer than 90 sessions.
Does correlation really spike when equities fall?
The standard claim is that bitcoin's diversification vanishes exactly when you need it, because correlation jumps in a sell-off. Our data half supports that. Correlation does jump, but with the size of the move rather than its sign.
| Subset of sessions | n | Correlation | Mean IBIT | Mean S&P 500 |
|---|---|---|---|---|
| All sessions | 567 | +0.43 | n/a | n/a |
| S&P 500 up days | 317 | +0.28 | n/a | n/a |
| S&P 500 down days | 250 | +0.25 | n/a | n/a |
| Worst decile of S&P days | 56 | +0.06 | −2.40% | −1.81% |
| Best decile of S&P days | 56 | +0.32 | +2.65% | +1.70% |
| Days with |S&P| ≥ 2% | 23 | +0.61 | n/a | n/a |
| Days with |S&P| < 2% | 544 | +0.38 | n/a | n/a |
| Low equity-vol tercile (5.3–10.5%) | 189 | +0.46 | n/a | n/a |
| Mid equity-vol tercile (10.5–13.8%) | 189 | +0.36 | n/a | n/a |
| High equity-vol tercile (13.8–48.6%) | 189 | +0.48 | n/a | n/a |
Source: our candle store and FRED; vol terciles use trailing 21-session realised volatility of the S&P, annualised. One caution on the middle rows: a correlation computed on days selected by the size of one variable is mechanically pulled toward zero, because most of that variable's range is gone. So +0.28 on up days and +0.25 on down days can't be set against +0.43 on everything. They can be set against each other, and they're near-identical.
Beta avoids that distortion, since conditioning on the x-variable leaves the slope unbiased. IBIT's beta to the S&P was 1.12 on up days and 0.85 on down days. Over this window a Bitcoin ETF participated less in equity declines than in equity rallies, which is the opposite of the crash-correlation story.
What holds up is the amplitude effect. On the 23 sessions where the index moved at least 2% either way, correlation was +0.61 against +0.38 elsewhere: big macro days pull everything into line and ordinary days don't. The decile rows price that. On the worst 10% of equity days the index averaged −1.81% and IBIT −2.40%, about 1.3 times the damage; on the best 10%, +1.70% against +2.65%, about 1.6 times the gain. Bitcoin amplifies both ways, slightly more on the upside. Nor are the volatility terciles monotonic (+0.46, +0.36, +0.48), so "correlation rises in stress" reads as a slogan rather than a measured regularity. A macro-event version of this test, across 22 FOMC decisions and 31 CPI prints, is in macro impact on Bitcoin ETF flows.
The price-column trap, and what it does to published numbers
Our flow table carries a bitcoin price next to each day, snapped at 07:00 UTC. Meanwhile the US session that the flow belongs to runs 13:30 to 20:00 UTC on the same date, so the price in row T was struck about six hours before the trading day that row describes. That offset is invisible unless you look for it, and it shifts every lag by exactly one session. We reran the flow-versus-return test twice, once on that price column with the usual backward difference and once on IBIT's own closes, which need no adjustment.
| Return series and the label it usually gets | Session the window actually covers | Correlation with flow on day T |
|---|---|---|
| 07:00 price, P(T) / P(T−1), called "same day" | session T−1 | +0.41 |
| 07:00 price, P(T+1) / P(T), called "next day" | session T | +0.40 |
| 07:00 price, P(T+2) / P(T+1), called "T+2" | session T+1 | +0.08 |
| IBIT close, session T−1 | session T−1 | +0.41 |
| IBIT close, session T (contemporaneous) | session T | +0.43 |
| IBIT close, session T+1 | session T+1 | +0.05 |
| IBIT close, session T+2 (first tradeable) | session T+2 | +0.02 |
| IBIT close, session T+5 | session T+5 | −0.00 |
Source: our daily flow series against our candle store, 565 to 567 paired sessions depending on lag, through 22 September 2026. The two halves line up row for row once the price version is shifted by one session, which is what makes the offset a fact rather than a modelling choice.
Two conclusions follow. The +0.41 usually reported as "flow and price move together on the day" is the previous session leaking in, and it leaks because flows are sticky: daily BTC net flow has a lag-one autocorrelation of +0.54 (ETH, +0.59), so yesterday's flow proxies for today's. The genuine contemporaneous figure is +0.43, and it isn't news. Creations happen because someone is buying, and buying moves the price. That describes one event rather than predicting the next.
The number anyone actually wants is the tradeable one, and it's close to zero. A day's flow isn't public until issuers post on the evening of T+1, so the first return you could trade is T+2. Our earlier work put that at +0.08. On a clean alignment the +0.08 turns out to be the T+1 relationship, and the true T+2 figure is +0.02. Both are too small to build on, but the correction matters: +0.08 at T+2 would be a weak edge, while +0.02 is noise. The cross-asset version of this test is in how to analyze ETF flows, and the column-by-column guide to our tape is how to read Bitcoin ETF flows.
What flows say about the equity market
Prices are one channel. Flows are another, and they answer a different question: do the people allocating to Bitcoin ETFs act like equity investors on the same day?
| Session group | n | Mean daily net flow | Share of outflow days |
|---|---|---|---|
| All sessions | 567 | +$74.0m | 42% |
| S&P 500 up days | 317 | +$143.6m | n/a |
| S&P 500 down days | 250 | −$14.2m | n/a |
| Best decile of S&P days | 56 | +$149.3m | 34% |
| Worst decile of S&P days | 56 | −$153.6m | 73% |
Source: our daily US spot Bitcoin ETF flow series against FRED, 18 June 2024 to 22 September 2026. Daily net flow correlates +0.21 with the same-session S&P return and +0.17 with the prior session's. Against the next session it's −0.01, so flows don't anticipate the stock market any better than they anticipate bitcoin.
The table reads more cleanly than the correlation. On a green equity day the Bitcoin ETF complex took in an average $143.6m; on a red day it was roughly flat at −$14.2m; on the worst tenth of equity sessions it bled $153.6m and printed an outflow nearly three days in four, against a 42% base rate. That's the diversification problem stated in flows rather than prices, and it's the more honest version, because it describes what holders did rather than what the mark-to-market did to them. ETH flows show a weaker version of the same tilt (+0.12). The daily series sits on our Bitcoin ETF flow tracker, and all thirteen assets on the dashboard.
Flows across crypto assets, which is where the real correlation lives
What a Bitcoin ETF's flow is actually correlated with isn't equities. It's other crypto ETFs, and only some of them. This is our own data, day-aligned across four tapes.
| Flow pair | Full overlap | Sessions | Common window (14 Nov 2025 – 22 Sep 2026) | Same-sign days |
|---|---|---|---|---|
| BTC – ETH | +0.49 | 531 | +0.76 | 71% |
| BTC – SOL | +0.11 | 178 | +0.23 | 53% |
| BTC – XRP | −0.06 | 162 | −0.07 | 51% |
| ETH – SOL | +0.17 | 176 | +0.30 | n/a |
| ETH – XRP | −0.03 | 162 | −0.03 | n/a |
| SOL – XRP | +0.30 | 134 | +0.30 | n/a |
Source: our daily net-flow series, weekdays only, days where both tapes printed zero excluded. Each overlap starts when the second product launched: ETH 23 July 2024, SOL 27 October 2025, XRP 14 November 2025. Cumulative net flow through 22 September 2026 is $56.9bn on BTC, $13.7bn on ETH, $1.75bn on SOL and $1.57bn on XRP.
BTC and ETH behave like one allocation decision: +0.76 in the recent common window, same direction on 71% of days. SOL sits in between and has been converging (+0.11 over the full overlap, +0.23 since November 2025). XRP is the outlier at −0.06 against BTC, with same-sign days at 51%, which is a coin flip. The XRP buyer isn't the bitcoin buyer, at least not on the same day.
That's more useful for portfolio work than any equity correlation, because it says a BTC-plus-ETH sleeve is one position wearing two tickers while XRP genuinely adds an independent flow driver. Two caveats: our SOL tape excludes Canary's SOLC column and doesn't cover Invesco's QSOL or Morgan Stanley's MSOL at all, so those figures describe most of the complex rather than all of it.
Bitcoin against gold, measured the same way
The "digital gold" framing makes a testable claim: bitcoin should correlate with equities about as little as gold does. Our flow table carries a gold price beside the bitcoin price, both struck at the same 07:00 UTC moment, so a like-for-like comparison is available even though neither aligns exactly with the equity close. Over 676 sessions from 11 January 2024:
- Bitcoin vs S&P 500: +0.39
- Gold vs S&P 500: +0.17
- Bitcoin vs gold: +0.23
By year, gold's equity correlation ran +0.18, +0.05 and +0.34 against bitcoin's +0.35, +0.43 and +0.44. Gold is the better equity diversifier in two years out of three, and the two have stopped looking different in 2026. Two caveats: our gold column is PAXG, a tokenised claim that tracks the spot metal within roughly 0.3% rather than an LBMA fix, and all three figures use the 07:00 snapshot rather than exchange closes, so read them as directionally right rather than precise. The fuller comparison of the wrappers is in gold ETF vs Bitcoin ETF.
What this changes for a portfolio
Correlation is the wrong variable to build the case on, in either direction. Four things follow.
- Size off volatility, not correlation. IBIT ran at 46.9% annualised against the index's 16.0%, so a 3% sleeve carries roughly the risk of a 9% sleeve of the S&P. That holds whether correlation is 0.25 or 0.65, and unlike correlation it's stable. Sizing frameworks: Bitcoin ETF portfolio allocation.
- Don't pay for a hedge you aren't getting. On the worst tenth of equity days IBIT averaged −2.40% against the index's −1.81%. There's no crash protection in that. Given the 0.85 downside beta there's no crash amplifier either, but this isn't a defensive holding.
- The diversification is idiosyncratic, not negative. With an R² of 0.18 the value sits in the 82% the equity market doesn't explain. That's a real property, just not the same one as "moves opposite to stocks".
- Treat BTC and ETH as one line item. Flow correlation of +0.76 in the recent window, same sign on 71% of days, says the marginal buyer makes one decision for both. For separate exposure inside crypto the flow data points at XRP.
And whenever a correlation figure is quoted, including here, the first question is the window. A 30-day reading off this dataset supported anything between −0.09 and +0.79 depending on the month.
FAQ
What is the correlation between Bitcoin ETFs and the S&P 500?
Using daily closes of IBIT over 567 sessions from 18 June 2024 to 22 September 2026, the correlation is +0.43, and +0.44 against the Nasdaq Composite. That's an R-squared of 0.18, so the equity market explains about 18% of a Bitcoin ETF's daily move. FBTC and GBTC give the same answer to within a point, since all US spot Bitcoin ETFs correlate +0.997 with each other.
Why do different sources quote such different correlation numbers?
Mostly window length. On rolling 30-session windows the IBIT versus S&P 500 correlation ran from -0.09 (ending 4 March 2025) to +0.79 (12 November 2025), with 90% of readings between +0.12 and +0.69. On one-year windows the same history only spans +0.38 to +0.53. The second cause is the instrument: spot bitcoin trades around the clock while the index trades six and a half hours, and correlating the two without aligning sessions changes the answer.
Does Bitcoin ETF correlation with stocks spike during crashes?
It rises with the size of the move, not the direction. On the 23 sessions where the S&P 500 moved 2% or more either way, correlation was +0.61 against +0.38 on calmer days. Upside and downside look alike: beta was 1.12 on equity up days and 0.85 on down days. On the worst decile of equity sessions the index averaged -1.81% and IBIT -2.40%, so there's amplification but no sign the relationship turns uniquely punishing in sell-offs.
Can Bitcoin ETF flow data predict the next day's price?
No. Flow on day T correlates +0.43 with that same session's IBIT return, which describes rather than predicts, since creations happen because someone is buying. A day's flow isn't published until the evening of T+1, so the first return you could act on is T+2, and that correlation is +0.02 (T+1 is +0.05). Earlier figures of +0.08 for T+2 came from a price column snapped at 07:00 UTC, which shifts every lag by one session.
Are Bitcoin ETF flows correlated with Ethereum, Solana and XRP ETF flows?
BTC and ETH strongly, the rest much less. Daily net flows correlate +0.49 across 531 overlapping sessions since July 2024, rising to +0.76 in the common window since November 2025, same sign on 71% of days. BTC against SOL is +0.11 over the full overlap and +0.23 recently. BTC against XRP is -0.06, with same-sign days at 51%, a coin flip. SOL and XRP correlate +0.30.
Is gold less correlated with equities than bitcoin?
In two of three years, yes. On the same 07:00 UTC snapshots across 676 sessions from January 2024, bitcoin correlated +0.39 with the S&P 500 and gold +0.17. By year, gold ran +0.18, +0.05 and +0.34 against bitcoin's +0.35, +0.43 and +0.44, so the gap narrowed sharply in 2026. The two correlate +0.23 with each other, so holding both isn't redundant.
Do Bitcoin ETFs see outflows when the stock market falls?
On average yes, sharply so on the worst days. Mean daily net flow was +$143.6m when the S&P 500 rose and -$14.2m when it fell, against +$74.0m across all sessions. On the worst decile of equity days the complex averaged -$153.6m and printed an outflow on 73% of sessions, versus a 42% base rate. Daily net flow correlates +0.21 with the same-session equity return.
Sources and further reading
- S&P 500 daily index level, Federal Reserve Bank of St. Louis (FRED), data from S&P Dow Jones Indices, series retrieved 23 September 2026.
- NASDAQ Composite daily index level, FRED, series retrieved 23 September 2026.
- iShares Bitcoin Trust ETF (IBIT) product page, BlackRock, for fund mechanics and expense ratio.
- iShares Bitcoin Trust filings on SEC EDGAR, for creation and redemption procedures.
- Internal: macro impact on Bitcoin ETF flows, how to analyze ETF flows, gold ETF vs Bitcoin ETF, Bitcoin ETF portfolio allocation.
Chỉ nhằm mục đích thông tin. Không phải lời khuyên đầu tư.


 ETH
 SOL
 XRP
 HYPE
 LINK
 HBAR
 AVAX
 DOGE
 LTC
 SUI
 DOT
 BNB
 NEAR
 TRX
 ZEC