We ran the Fed and CPI calendars against 676 sessions of our own Bitcoin ETF flow data. The FOMC effect is zero, the CPI effect is weak, and the dollar explains nothing.
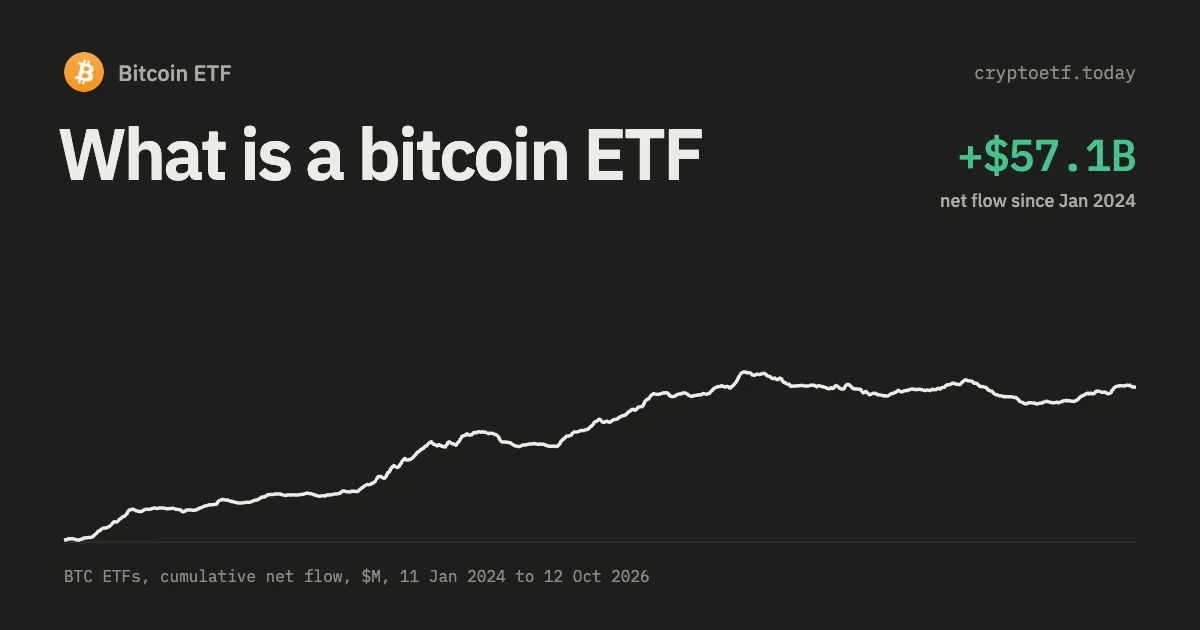
TL;DR. Across 676 trading sessions from 11 January 2024 to 22 September 2026 the US spot Bitcoin ETF complex took in $56.9bn, a mean of +$84.2m a day. Around the 22 FOMC decisions in that window the mean was +$63.0m, lower rather than higher, and the gap doesn't survive a test (permutation p = 0.38 on 20,000 draws). Around the 31 CPI releases it was +$116.8m against +$68.8m on every other session, a tilt that's consistent in direction but weak in evidence (p = 0.09). Daily flow correlates +0.03 with the change in the ten-year Treasury yield and −0.05 with the Fed's broad dollar index, which is to say not at all. What does move the series is the regime and the plumbing: GBTC's conversion redemptions account for −$27.8bn of the arithmetic, and only 7 of the 20 largest flow days sit within three sessions of a Fed or CPI date, against 49% of all sessions.
Sommaire · 10 sections
- What this piece measures, and what it can't
- Flows around FOMC decisions: nothing there
- Flows around CPI prints: a small, fragile tilt
- The dollar and the ten-year: what we could check, and what we couldn't
- Nine regimes, and a flow series that changed character
- Flow and price: three different numbers
- What macro doesn't explain: the structural days
- A reading routine that survives the numbers
- FAQ
- Sources and further reading

What this piece measures, and what it can't
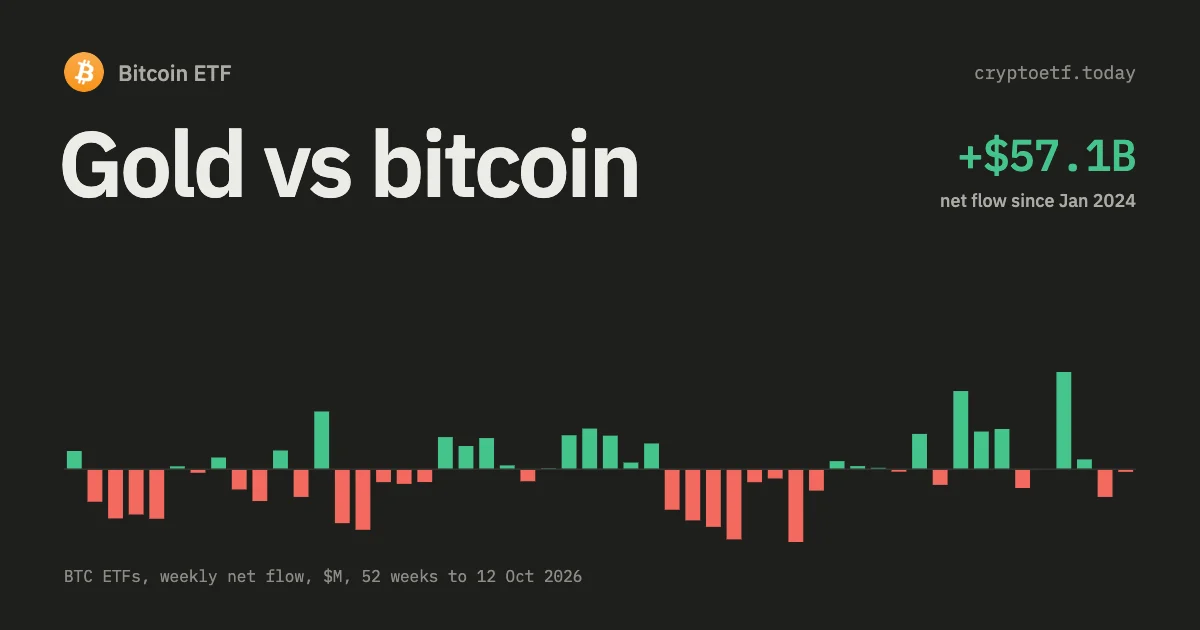
Most writing about macro and Bitcoin ETF flows argues from vibes: a dovish Fed brings money in, a strong dollar pushes it out. We have the series, so we counted instead. Every figure below comes from our own daily flow data, read 23 September 2026 and covering 676 sessions through 22 September 2026, the series behind the Bitcoin ETF flows page.
The method is a plain event study. For each event we take the flow on the decision or release day (call it T), the three sessions before and the three after, then compare that mean with every session outside such a window. Significance is checked twice, with a Welch t-test and a permutation test that redraws the window 20,000 times.
Three limits up front. The series has no intraday resolution, so an 08:30 print and a creation struck at 16:00 land on the same row. We can't split events by surprise, because there's no consistent free consensus series back to January 2024, so a hot CPI and a cool one count the same. And the windows overlap: on 12 June 2024 the CPI release and the FOMC decision fell on the same day. None of that turns a real effect into nothing, but it blunts what a null result proves. The wider set of traps is in how to analyze ETF flows without fooling yourself.
For orientation: the baseline session is +$84.2m, the median +$52.1m, the standard deviation $341.8m, and 402 sessions were positive against 274 negative. A $100m day is inside the noise. Half a billion is not.
Flows around FOMC decisions: nothing there
The 22 FOMC decision days are the second day of each scheduled meeting, from the Fed's own calendar: eight in 2024, eight in 2025 and six so far in 2026, the last on 16 September 2026. There were no intermeeting actions to add.
| Window (trading sessions) | FOMC decisions, 22 events | CPI releases, 31 events |
|---|---|---|
| T−3 to T−1 | +$92.3m per day (66) | +$82.3m per day (93) |
| T, the day itself | +$35.7m (22) | +$160.2m (31) |
| T+1 to T+3 | +$42.9m per day (66) | +$136.8m per day (93) |
| Whole T−3 to T+3 window | +$63.0m per day (154) | +$116.8m per day (217) |
| Every session outside the window | +$90.5m per day (522) | +$68.8m per day (459) |
| Difference | −$27.5m per day | +$48.0m per day |
| Positive days in window vs outside | 60% vs 59% | 62% vs 58% |
| Welch t, p-value | −0.91, p = 0.36 | +1.75, p = 0.08 |
| Permutation p, 20,000 draws | 0.38 | 0.09 |
Source: our daily series through 22 September 2026; FOMC dates from the Fed's meeting calendar, CPI dates from the BLS archive, both read 23 September 2026.
The FOMC column says something slightly more interesting than "no effect". Flow into the meeting runs a little above baseline, the decision day prints +$35.7m, under half a normal session, and the three days after run at +$42.9m: the shape of authorised participants standing back rather than piling in. It also proves nothing. The standard error on 154 sessions of a series with a $342m standard deviation is about $30m, and the gap is $27.5m.
Splitting by what the Fed actually did
Averaging cuts and holds together could hide two effects that cancel, so we classified each meeting by the change in the target range. Six delivered cuts (September, November and December 2024; September, October and December 2025), fifteen held, and one raised: on 16 September 2026 the Committee moved the range up a quarter point to 3.75–4.00%.
| Decision | Meetings | Mean flow, T−3 to T+3 | Against the $84.2m baseline |
|---|---|---|---|
| Rate cut | 6 | +$122.4m per day | +$38m |
| Rate cut, excluding the November 2024 meeting | 5 | +$45.1m per day | −$39m |
| Hold | 15 | +$34.0m per day | −$50m |
| Hike (16 Sep 2026) | 1 | +$141.7m per day | +$58m |
The second row is the point. Cut meetings look supportive until you notice that one of the six, on 7 November 2024, fell two days after the US presidential election. That week alone carried +$3.30bn over ten sessions, including the largest day in the entire series (+$1,373.8m on 7 November 2024, of which BlackRock's IBIT was +$1,119.9m). Drop that meeting and the other five cuts average +$45.1m a day, below a normal session. The Fed cut six times in this sample and the flow series never noticed. The lone hike is one event, not a sample: −$296.0m on the day, then +$530.5m a day over the next three sessions.
Flows around CPI prints: a small, fragile tilt
The CPI column looks better, and honesty requires saying how much better. The 31 releases come from the BLS archive, where the filenames carry the exact date. Around them the complex averages +$116.8m a day against +$68.8m elsewhere, the release day is the strongest slot in the study at +$160.2m, and the next three run at +$136.8m. Direction, timing and the share of positive days all point the same way.
The evidence is still thin: p = 0.08 to 0.09, so a gap this size turns up by chance about one time in eleven, and with 31 events there's no honest way to call it a finding. It's a plausible hypothesis, since the CPI number is genuinely new at 08:30 while an FOMC decision has been priced into futures for weeks.
The accidental experiment of late 2025
The CPI calendar handed us one natural test. The October 2025 index was never published, because of the 2025 lapse in federal appropriations, and the September report slipped to 24 October. That left 37 sessions between 25 October and 17 December 2025 with no CPI release at all, the longest gap of the ETF era.
If inflation prints drove flows, a two-month blackout should have produced a quiet series. It produced the opposite: −$4.24bn over those 37 sessions, −$114.7m a day, only 46% of days positive, with bitcoin falling from $114,585 to $87,823. The longest sustained outflow stretch in the history happened in the window with the fewest macro prints in it.
The dollar and the ten-year: what we could check, and what we couldn't
The widely repeated claim is that Bitcoin ETF flows run against the dollar and against real yields, often with numbers attached (−0.4 to −0.6 against the dollar, around −0.6 against ten-year TIPS). We tried to reproduce that and couldn't. One caveat first: ICE's DXY is a licensed index we can't redistribute, so we used the Fed's own nominal broad dollar index (the H.10 series, on FRED as DTWEXBGS), which is trade-weighted against a wider basket than DXY's six currencies. For yields we used DGS10 and the ten-year TIPS yield DFII10, downloaded 23 September 2026. What can't be checked against those three series we've left out rather than asserted.
| Correlation of net flow with… | Daily | Weekly | Monthly |
|---|---|---|---|
| Change in 10-year Treasury yield | +0.03 (671) | +0.06 (142) | +0.23 (33) |
| Change in 10-year real (TIPS) yield | −0.03 (671) | −0.03 (142) | +0.08 (33) |
| Change in Fed broad dollar index | −0.05 (670) | −0.02 (141) | +0.17 (33) |
| Bitcoin’s own return (daily column is the prior session — see the alignment note above) | +0.41 (675) | +0.69 (141) | +0.76 (32) |
Sources: our flow series and FRED DGS10, DFII10 and DTWEXBGS through 22 September 2026. Observation counts in brackets.
Daily and weekly, the three macro correlations round to zero. Monthly they get noisier rather than cleaner and the signs flip: +0.23 against the nominal ten-year, the opposite of the textbook story, on 33 observations with p = 0.20, and +0.17 against the dollar, also the wrong sign and also insignificant. We can't rule out a relationship hiding behind 33 months of data, and we can't produce one either. The last row is the contrast, with one caveat carried over from the alignment note: that +0.41 is flow against the previous session, and contemporaneously it is +0.39. Either way bitcoin’s own return dwarfs every macro series here, and monthly it reaches +0.76 against the same flows. Nor is the price doing the work the flows won't. Its monthly return runs +0.30 against the nominal ten-year (p = 0.09), +0.15 against real yields and −0.02 against the dollar.
Nine regimes, and a flow series that changed character
Averages across three years hide the thing that matters. We cut the history into swings with a 25% zigzag on the daily close, giving nine regimes, and measured the flow inside each. GBTC is broken out for reasons the next section covers.
| Regime | Sessions | BTC | Net flow | Ex-GBTC | Per day | Positive days | 10y real | Broad USD |
|---|---|---|---|---|---|---|---|---|
| 11 Jan – 14 Mar 2024, launch surge | 44 | +57% | +$11.96bn | +$23.62bn | +$272m | 82% | +23bp | +0.3% |
| 14 Mar – 6 Aug 2024, first drawdown | 100 | −26% | +$5.36bn | +$13.12bn | +$54m | 61% | −21bp | +2.8% |
| 6 Aug – 18 Dec 2024, post-election run | 95 | +96% | +$19.64bn | +$21.66bn | +$207m | 72% | +40bp | +3.2% |
| 18 Dec 2024 – 9 Apr 2025, Q1 slide | 76 | −28% | −$1.23bn | +$0.39bn | −$16m | 45% | −11bp | −0.8% |
| 9 Apr – 7 Oct 2025, the 2025 leg | 125 | +64% | +$26.50bn | +$27.93bn | +$212m | 73% | −28bp | −4.8% |
| 7 Oct 2025 – 6 Feb 2026, the big unwind | 85 | −50% | −$6.55bn | −$4.78bn | −$77m | 40% | +9bp | −1.9% |
| 6 Feb – 11 May 2026, spring rebound | 65 | +32% | +$5.11bn | +$5.58bn | +$79m | 63% | +7bp | −0.2% |
| 11 May – 1 Jul 2026, capitulation | 36 | −29% | −$8.47bn | −$7.65bn | −$235m | 14% | +30bp | +2.6% |
| 1 Jul – 22 Sep 2026, summer recovery | 58 | +47% | +$5.74bn | +$6.47bn | +$99m | 64% | +37bp | −1.3% |
Source: our daily series through 22 September 2026; yield and dollar changes measured first to last session of each regime, from FRED.
Two readings come out of it. The first is that the flow changed character. Through spring and summer 2024 bitcoin fell 26% over 100 sessions and the complex still took $5.36bn, 61% of days positive, or $13.12bn excluding GBTC. Money arrived against the price, which is what a new wrapper does while advisers and platforms switch it on. By May and June 2026 a drawdown of almost identical depth (−29%) produced −$8.47bn, only 14% of sessions positive, with 13 consecutive redemption days ending 3 June 2026. Same price move, opposite flow: the holder base stopped being a backlog of first-time buyers and became a book that gets sold.
The second is that the macro columns don't line up. The strongest inflow regime of 2024 ran with the broad dollar up 3.2% and real yields up 40bp, both supposed to suppress flows. The summer 2026 recovery took +$5.74bn with real yields up another 37bp, and the late-2025 unwind lost $6.55bn while the dollar weakened. Exactly one of the nine regimes behaves as the textbook predicts, the May to July 2026 capitulation. One in nine is what coincidence looks like.
Flow and price: three different numbers
"Flows correlate with price" usually gets quoted as one figure. There are at least three, and they say different things. Before any of them, though, the alignment, because it quietly moves every daily number by a session.
The price carried next to each flow row is a snapshot struck at 07:00 UTC. The US session that the flow belongs to runs 13:30 to 20:00 UTC on that same date, so the price in row T was fixed about six and a half hours before the trading day the row describes. Difference that column backwards and you are measuring the previous session, which means every rung of the ladder below sits one step earlier than its label. That is measured rather than assumed: across the 568 sessions our column shares with IBIT, its return correlates +0.840 with IBIT's previous close-to-close, +0.132 with the same day's and −0.029 with the next day's. Only one of those readings is a match, and it isn't the one the labels imply. The full derivation is in Bitcoin ETF correlation with equities.
| Pairing, as it is usually labelled | Correlation | The session it actually measures |
|---|---|---|
| Flow on T vs price level on T | +0.08 | A level rather than a return: flow doesn't scale with the price. |
| Flow on T vs return into T, called "same day" | +0.41 | Session T−1. Money arriving behind yesterday's move. |
| Flow on T vs return out of T, called "next day" | +0.40 | Session T. The genuinely contemporaneous figure. |
| Flow on T vs return T+1 to T+2, called "T+2" | +0.08 | Session T+1. Already history when the flow is published. |
| Flow on T vs return T+2 to T+3, called "T+3" | −0.02 | Session T+2, the first one that could be traded. |
| Weekly flow vs same week | +0.69 | Strong, still contemporaneous. |
| Weekly flow vs next week | +0.14 | Not tradeable. |
| Monthly flow vs same month | +0.76 | Strong. |
| Monthly flow vs next month | +0.07 | Nothing. |
Source: our series through 22 September 2026: 676 sessions, 141 weeks, 32 complete months. The weekly and monthly buckets absorb a one-day offset and need no relabelling; the daily rows do.
Rerun the same scan on IBIT's own daily closes, which carry no snapshot offset, and the ladder lands where its labels say it should:
| Flow on session T against | Correlation |
|---|---|
| IBIT return, same session T | +0.43 |
| IBIT return, session T+1 | +0.05 |
| IBIT return, session T+2 — the first tradeable one | +0.02 |
Source: IBIT closes over the 568 sessions shared with our flow series, 18 June 2024 to 22 September 2026.
So the +0.40 that reads like predictive power is not a forecast at all: it is the same session, described rather than anticipated. Creations happen because someone is buying, and buying moves the price. The +0.41 sitting above it, the one usually quoted as the same-day link, is the previous session leaking in, and it leaks because the series is sticky — daily BTC net flow has a lag-one autocorrelation of +0.54, so yesterday's flow stands in for today's.
Which leaves the number anyone actually wants, and it is smaller than we previously published. A day's flow isn't visible until issuers post on the evening of T+1, so the first return you could act on is T+2. We used to put that at +0.08. On the shifted column +0.08 is the T+1 relationship — the move that had already happened while the flow figure was still unpublished — and the step that genuinely reaches T+2 is −0.02 there, +0.02 on IBIT's clean closes. That is four hundredths of one percent of variance. The correction runs against the trade, not for it: +0.08 at T+2 would be a thin edge worth testing, while +0.02 is indistinguishable from noise, which is the conclusion this section already reached and can now state without the caveat. The same check across assets is in how to analyze ETF flows; our columns are explained in how to read Bitcoin ETF flows.
The contemporaneous figure also decays year by year: +0.49 in 2024, +0.42 in 2025, +0.32 across the 181 sessions of 2026.
What macro doesn't explain: the structural days
Here's the number that reframes the question. Of the 20 largest absolute flow days, seven fall within three sessions of an FOMC decision or a CPI release. But 333 of the 676 sessions, 49%, fall within three sessions of one of those dates, so chance alone predicts about ten. The biggest days are, if anything, slightly less macro-adjacent than average. They cluster around plumbing, and four cases carry most of the distortion:
- The GBTC conversion. Grayscale's trust converted into an ETF on 11 January 2024 and its holders have redeemed ever since: −$27.84bn across 422 non-zero sessions, of which −$21.50bn landed in 2024, then −$3.76bn in 2025 and −$2.59bn so far in 2026. Through 30 June 2024 the headline net was +$14.53bn while everything except GBTC took +$33.04bn. April 2024 is the sharpest case: the headline reads −$345m and gets written up as risk-off after a hot inflation print, while GBTC redeemed −$2,535m and the other nine funds took +$2,190m. That month wasn't macro. It was legacy holders leaving one fund at a 1.50% fee.
- Concentration. BlackRock's IBIT has taken +$64.86bn across 601 non-zero sessions, 114% of the complex's entire net; everything else together is negative. One issuer's distribution deals move the headline more than any Fed meeting.
- New listings. Grayscale's Mini Bitcoin Trust began printing on 31 July 2024, posted +$191.1m on its second session and has taken +$2.93bn over 264 sessions, much of it migration out of GBTC rather than new money. Morgan Stanley's MSBT started on 8 April 2026 and has added +$733.2m over 69 sessions.
- Events off the macro calendar. The biggest week is 18–22 November 2024 at +$3.35bn and the biggest day 7 November 2024 at +$1,373.8m, both post-election repricing rather than the Fed meeting inside the same fortnight.
So any macro study here has to subtract issuer rotation first. Run 2024 without splitting GBTC out and you'll discover a "macro effect" in the spring that is entirely a conversion queue. The fund-by-fund breakdown is on the Bitcoin ETF flows page, and the mechanics that make conversions look like outflows are in what a Bitcoin ETF is.
A reading routine that survives the numbers
So here's what we'd do with a macro calendar and a flow series.
- Don't trade the FOMC on flow. Six cuts, one hike and fifteen holds produced no measurable pattern once the November 2024 election week comes out. Expect the decision day to run quiet, near +$36m against a +$84m baseline, and don't read that as a signal.
- Treat CPI as a hypothesis. The tilt is real in direction (+$117m against +$69m) and it's the strongest effect we found, but at p = 0.09 it's one odd quarter from vanishing. Revisit once the sample passes 50 releases.
- Check the regime, and subtract the rotation. The same −29% price move produced +$13bn in 2024 and −$8bn in 2026. And before blaming a month on macro, look at the GBTC column and at whether anything listed recently; both have flipped monthly signs here.
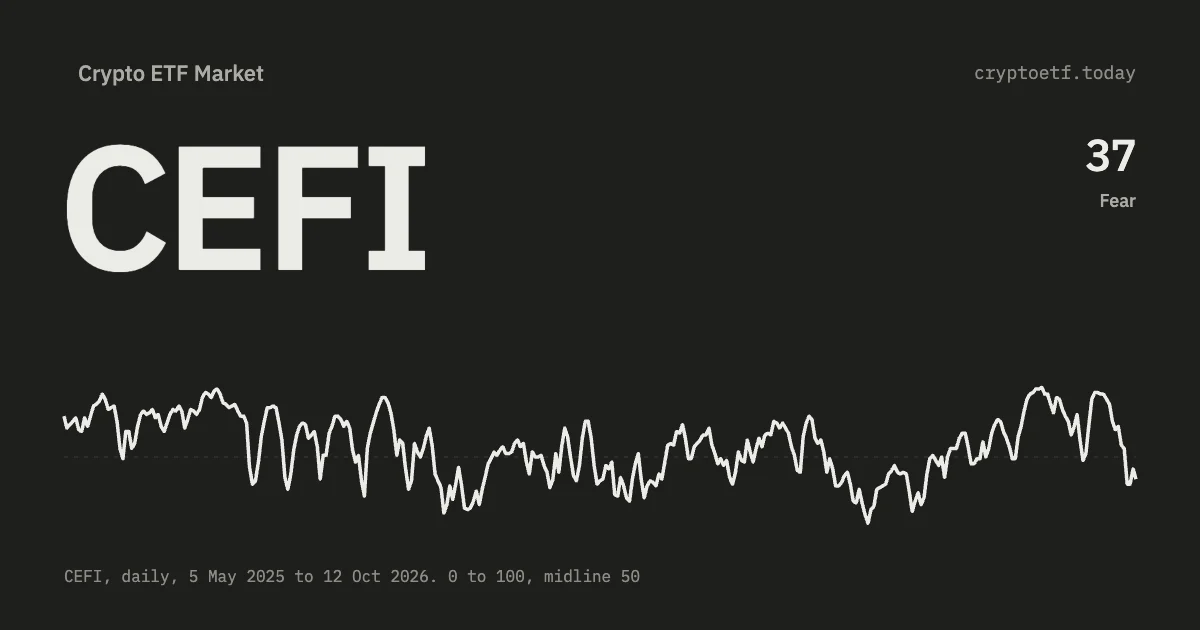
- Prefer a smoothed reading to a daily number. Our CEFI index scales each day's flow by market cap and smooths it, removing most single-fund noise. On 22 September 2026 the Bitcoin reading was 87 on a 0–100 scale and the composite 90. Construction is in the CEFI index explainer; current figures are on the crypto ETF sentiment index.
None of this says macro is irrelevant to bitcoin. It says this series, primary-market creations and redemptions in twelve US funds, isn't where the macro signal shows up. Flow measures how much money moved through one regulated pipe on one day, and for the first two years of that pipe's life its own plumbing was louder than the Fed.
FAQ
Do Bitcoin ETF flows spike around Fed meetings?
No. Across the 22 FOMC decisions between January 2024 and September 2026, mean daily net flow in the seven-session window around each was +$63.0m against +$90.5m on all other sessions, and the decision day itself averaged +$35.7m against a +$84.2m baseline. Neither a Welch t-test (p = 0.36) nor a 20,000-draw permutation test (p = 0.38) tells that apart from chance.
Does a Fed rate cut bring money into Bitcoin ETFs?
Not in this sample. The six cut meetings averaged +$122.4m a day across their windows, but one was 7 November 2024, two days after the US presidential election, and that week carried +$3.30bn on its own. Excluding it, the other five averaged +$45.1m a day, below the +$84.2m baseline.
Do CPI releases move Bitcoin ETF flows?
Possibly, weakly. Around the 31 CPI releases the complex averaged +$116.8m a day against +$68.8m elsewhere, with the release day the strongest slot at +$160.2m. The p-value is 0.08 to 0.09 on 31 events: the largest macro effect we could measure, and still not significant at any conventional threshold.
How well do Bitcoin ETF flows track the dollar and Treasury yields?
Barely at all. Using the Fed broad dollar index and the nominal and real ten-year yields from FRED, daily net flow correlates +0.03 with the change in the ten-year, −0.03 with the TIPS yield and −0.05 with the dollar over roughly 670 observations; weekly figures match. Monthly, all three turn positive, the opposite of the usual claim, on 33 observations and without significance.
Can Bitcoin ETF flows predict the price?
No, and the honest figure is smaller than the one usually quoted. The price column beside our flow rows is a 07:00 UTC snapshot while the US session runs 13:30 to 20:00 UTC, so every daily lag measured on it sits one session early: the +0.41 reported as "same day" is really the previous session, and the +0.40 reported as "next day" is the contemporaneous one. Realigned on IBIT’s own closes, flow on day T correlates +0.43 with session T, +0.05 with T+1 and +0.02 with T+2. Since a day’s flow is published only on the evening of T+1, T+2 is the first return anyone could act on, which puts the tradeable correlation at +0.02 rather than the +0.08 we previously quoted. Weekly flow correlates +0.69 with the same week and +0.14 with the next; monthly, +0.76 and +0.07.
Why did Bitcoin ETFs keep taking inflows during the 2024 drawdown but not the 2026 one?
The holder base changed. Between 14 March and 6 August 2024 bitcoin fell 26% and the complex still took +$5.36bn, or +$13.12bn excluding GBTC, with 61% of sessions positive. Between 11 May and 1 July 2026 a 29% fall produced −$8.47bn, only 14% of sessions positive, with 13 straight redemption days ending 3 June 2026. The first was a backlog of first-time buyers, the second an established book being sold.
What actually drives the biggest Bitcoin ETF flow days?
Structure, mostly. Only 7 of the 20 largest flow days fall within three sessions of an FOMC or CPI date, while 49% of all sessions do. GBTC’s conversion redemptions account for −$27.84bn of the cumulative arithmetic and IBIT for +$64.86bn, or 114% of the complex net; the two largest events were the November 2024 post-election week and the January 2024 launch.
Sources and further reading
- Federal Reserve, FOMC meeting calendars: the 2024, 2025 and 2026 meeting dates used for the event study.
- Federal Reserve, FOMC statement of 16 September 2026: the quarter-point increase to a 3.75–4.00% target range.
- Bureau of Labor Statistics, CPI news release archive: exact publication dates, and the note that the October 2025 index was not published because of the lapse in federal appropriations.
- Bureau of Labor Statistics, CPI release schedule: forward dates through 2026.
- FRED, nominal broad US dollar index (DTWEXBGS), plus DGS10 and DFII10 for nominal and real ten-year yields, all read 23 September 2026.
À titre informatif uniquement. Ceci n’est pas un conseil en investissement.

 ETH
 SOL
 XRP
 HYPE
 LINK
 HBAR
 AVAX
 DOGE
 LTC
 SUI
 DOT
 BNB
 NEAR
 TRX
 ZEC